RetireTree Logo RetireTree
Launch App

Will Your Retirement Savings Last?

Test your retirement plan with 150+ years of historical market data. Run Monte Carlo simulations, analyze withdrawal strategies, and plan with confidence using professional-grade tools.

Powered by rigorous data analysis

📊 150+ Years of Data
🎯 Monte Carlo Analysis
🏛️ Academic Methodology
🆓 Free Core Features

Professional-Grade Retirement Analysis

Go beyond basic calculators. Use the same analytical tools trusted by financial professionals.

📈

Historical Market Analysis

Test your strategy against 150+ years of real market data including the Great Depression, 2008 crisis, and every market regime since 1871.

🎲

Monte Carlo Simulations

Run thousands of scenarios to understand the probability of success. See not just averages, but the full range of possible outcomes.

⚙️

Advanced Withdrawal Strategies

Model complex scenarios: dynamic withdrawals, pension income, healthcare costs, and custom cashflow timing.

🔮

Future Market Projections

Create custom market scenarios: bull markets, bear markets, stagflation periods. Test how your plan performs under different economic conditions.

📊

Interactive Visualizations

Understand your results through beautiful charts: success rates, portfolio paths, withdrawal sustainability, and regime analysis.

🔒

Privacy-First Approach

Your financial data stays private. All calculations run in your browser. No account required for core features.

See RetireTree In Action

These are real visualizations generated by RetireTree. See exactly what insights you'll get from your retirement analysis.

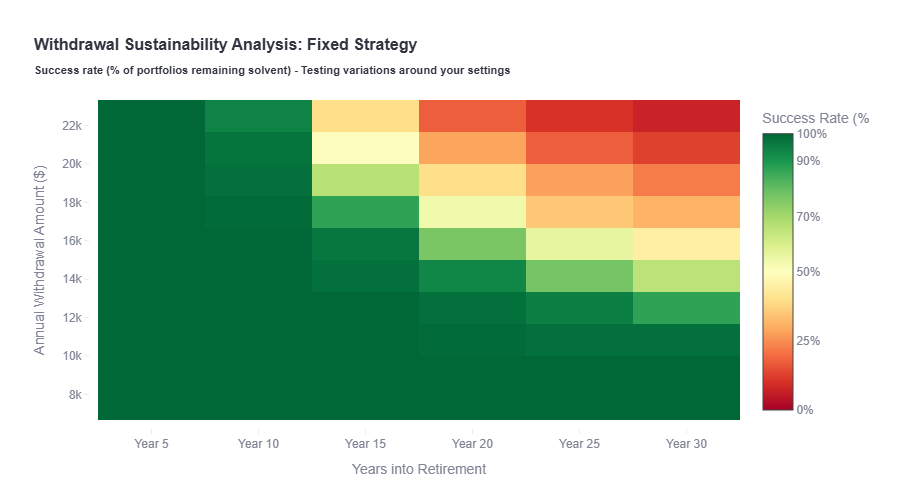
Withdrawal Sustainability Analysis - Chart showing withdrawal strategy performance over time

Withdrawal Sustainability

Analysis showing how sustainable your withdrawal strategy is over time and across different market conditions.

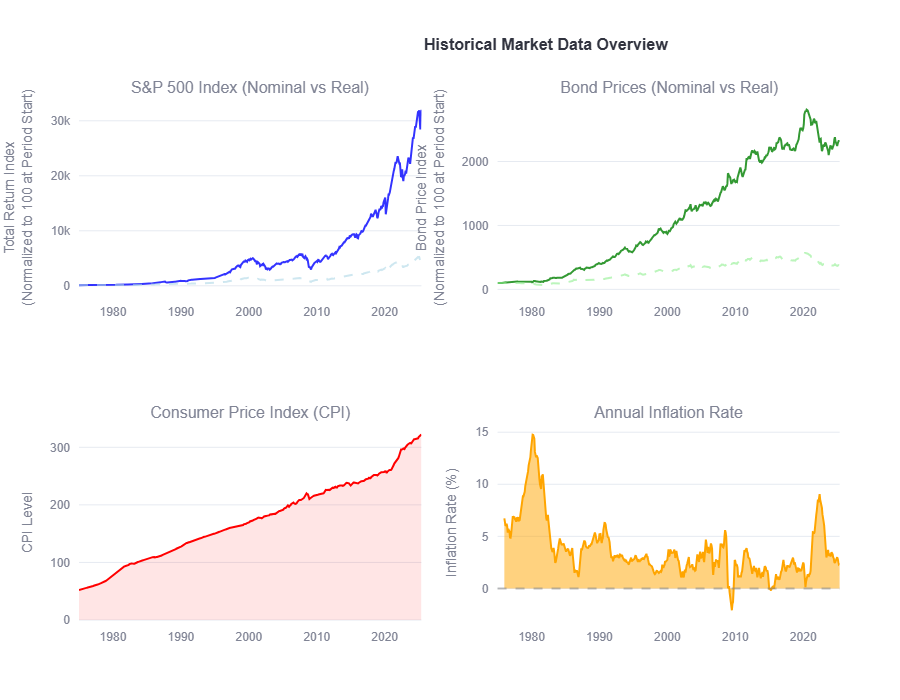
Historical Market Data - 150+ years of S&P 500, bonds, inflation rates, and CPI trends

Historical Market Data

150+ years of market history showing S&P 500, bonds, inflation rates, and CPI trends that power our analysis.

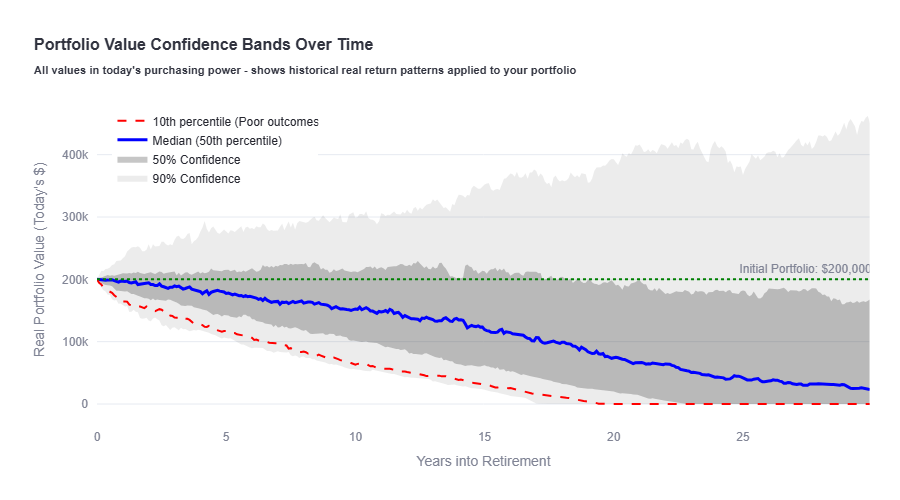
Portfolio Confidence Bands - Portfolio value projections with confidence intervals over time

Portfolio Confidence Bands

Portfolio value projections over time with confidence bands showing the range of likely outcomes for your retirement.

Try a Live Simulation

Move the sliders to simulate 100 possible retirement outcomes over 30 years. Results vary each time to reflect market uncertainty.*

*Assumes 7% average market return and 12% volatility. For demonstration purposes only.

Ready to Test Your Retirement Plan?

Join thousands who've gained confidence in their retirement strategy. Start with our free analysis tool.