£4,989 in 1989 pounds. £634 in 1959 pounds.
Harold Macmillan told Britons they'd "never had it so good." Thirty years later, the Berlin Wall fell, Thatcher was in power, and the pound had lost most of its purchasing power. For investors, the headline numbers masked a painful truth.
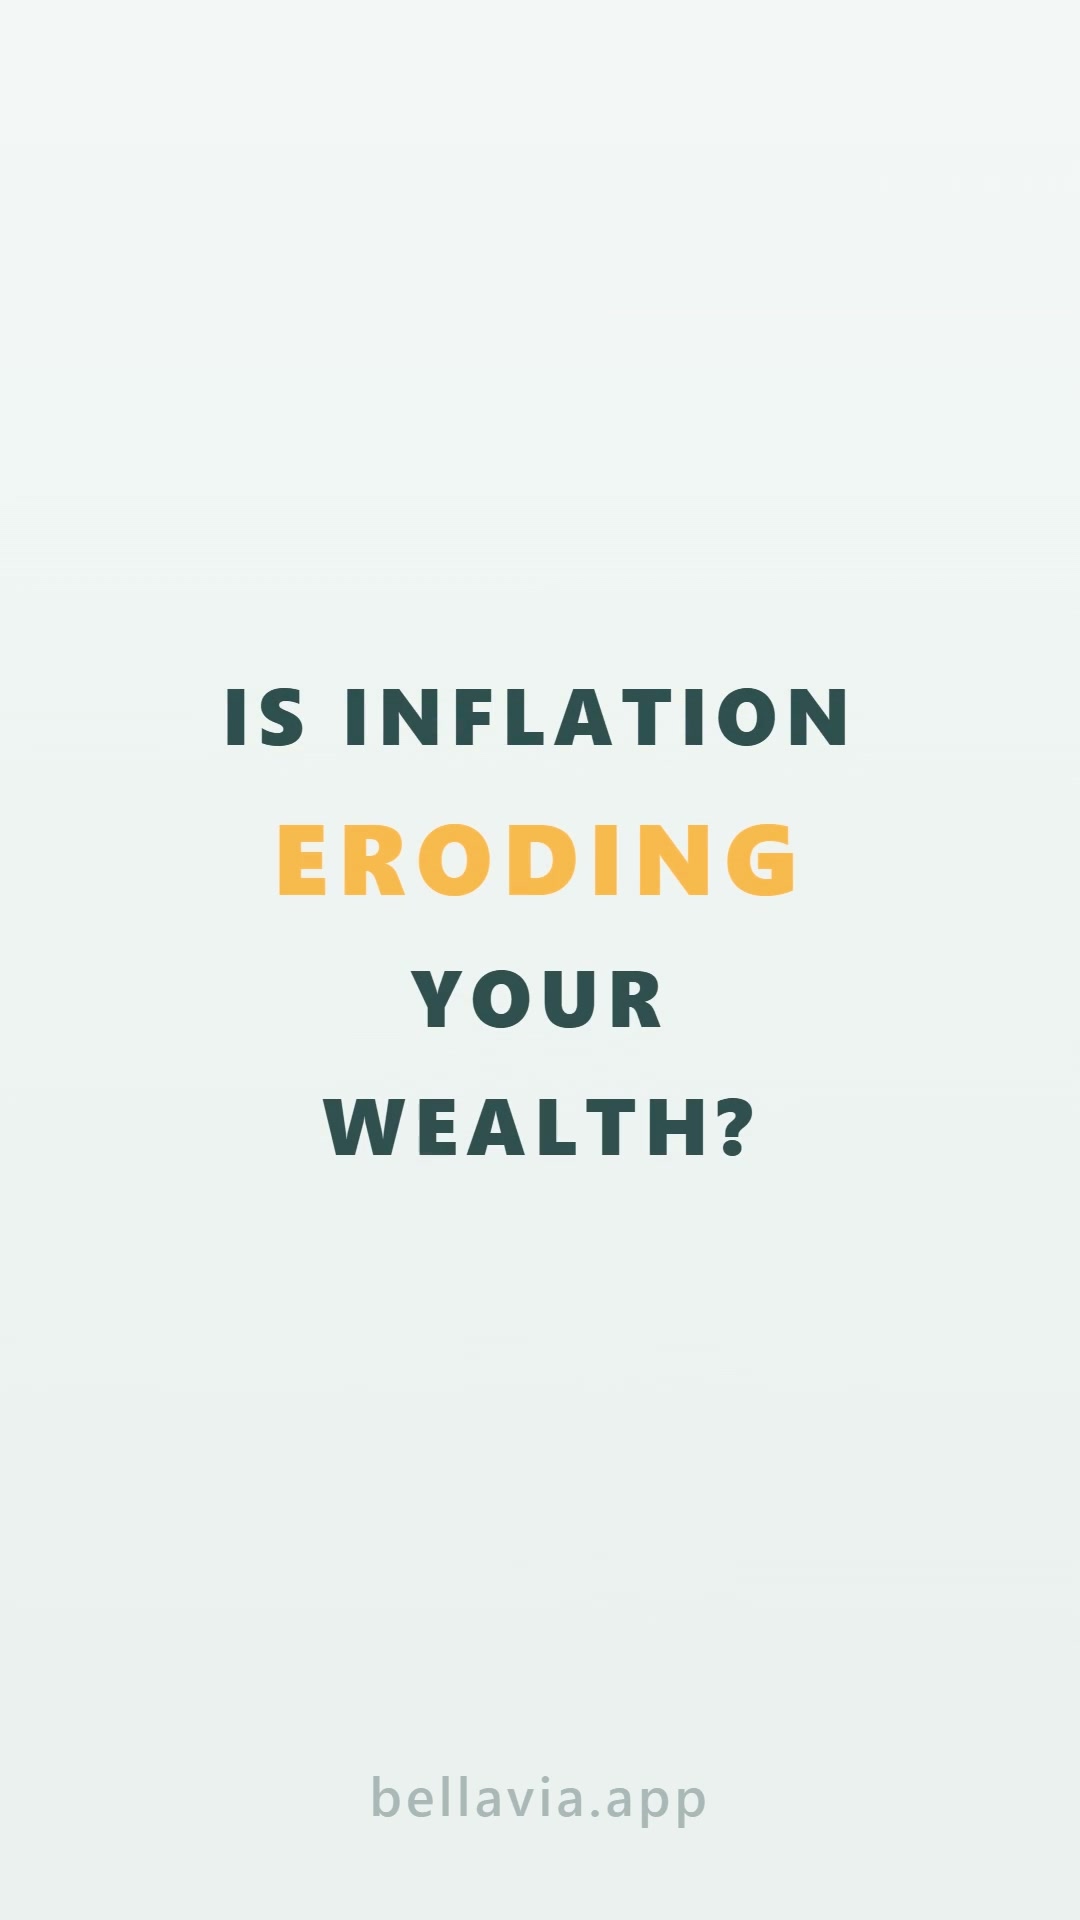
What the headlines said
UK equities returned nearly 50x over this period. £100 became £4,989. Strong nominal performance by any measure, suggesting three decades of robust wealth creation.
What actually happened
Inflation averaged 7.1% per year across the entire span. The 1970s were devastating — double-digit inflation, oil crises, the three-day week, currency devaluation. Even the relative stability of the 1960s and 1980s couldn't offset the damage. By 1989, the pound bought a fraction of what it had in 1959.
In real terms, £4,989 was worth £634. The market grew, but the currency shrank faster.
£4,989 on your statement. £634 of actual purchasing power. That's the British disease of this era in one line.
Inflation was not a background detail in this period — it was the dominant force shaping investment outcomes. The nominal return told a story of prosperity. The real return told the truth.
Backtest UK market periods on Bellavia.