 Video
Video
UK 1959–1989: 7.1% Inflation — Supermac to Berlin Wall
£100 in UK stocks became £4,989 nominally but just £634 in real terms. 7.1% annual inflation over 30 years consumed …
Video shorts, infographics, and charts on retirement planning
Video
£100 in UK stocks became £4,989 nominally but just £634 in real terms. 7.1% annual inflation over 30 years consumed …
 Video
Video
46x your money. The single best 30-year return since the Depression. It started in chaos when BusinessWeek declared the 'Death …
 Video
Video
Retiring in 1929 with a 5% withdrawal rate. The portfolio lasted 29 years and ran out in year 30. Almost …
 Video
Video
Starting in 1990 meant investing through the dot-com crash and the 2008 financial crisis. $360K in contributions still became $1.0M.
 Video
Video
59% of historical 30-year periods turned $1,000/month into $1M+. Median outcome: $1,043,646 — nearly 3x your $360K in contributions.
 Video
Video
The ultra-conservative 3% withdrawal strategy: 100% success rate across every historical period. But is leaving money on the table its …
 Video
Video
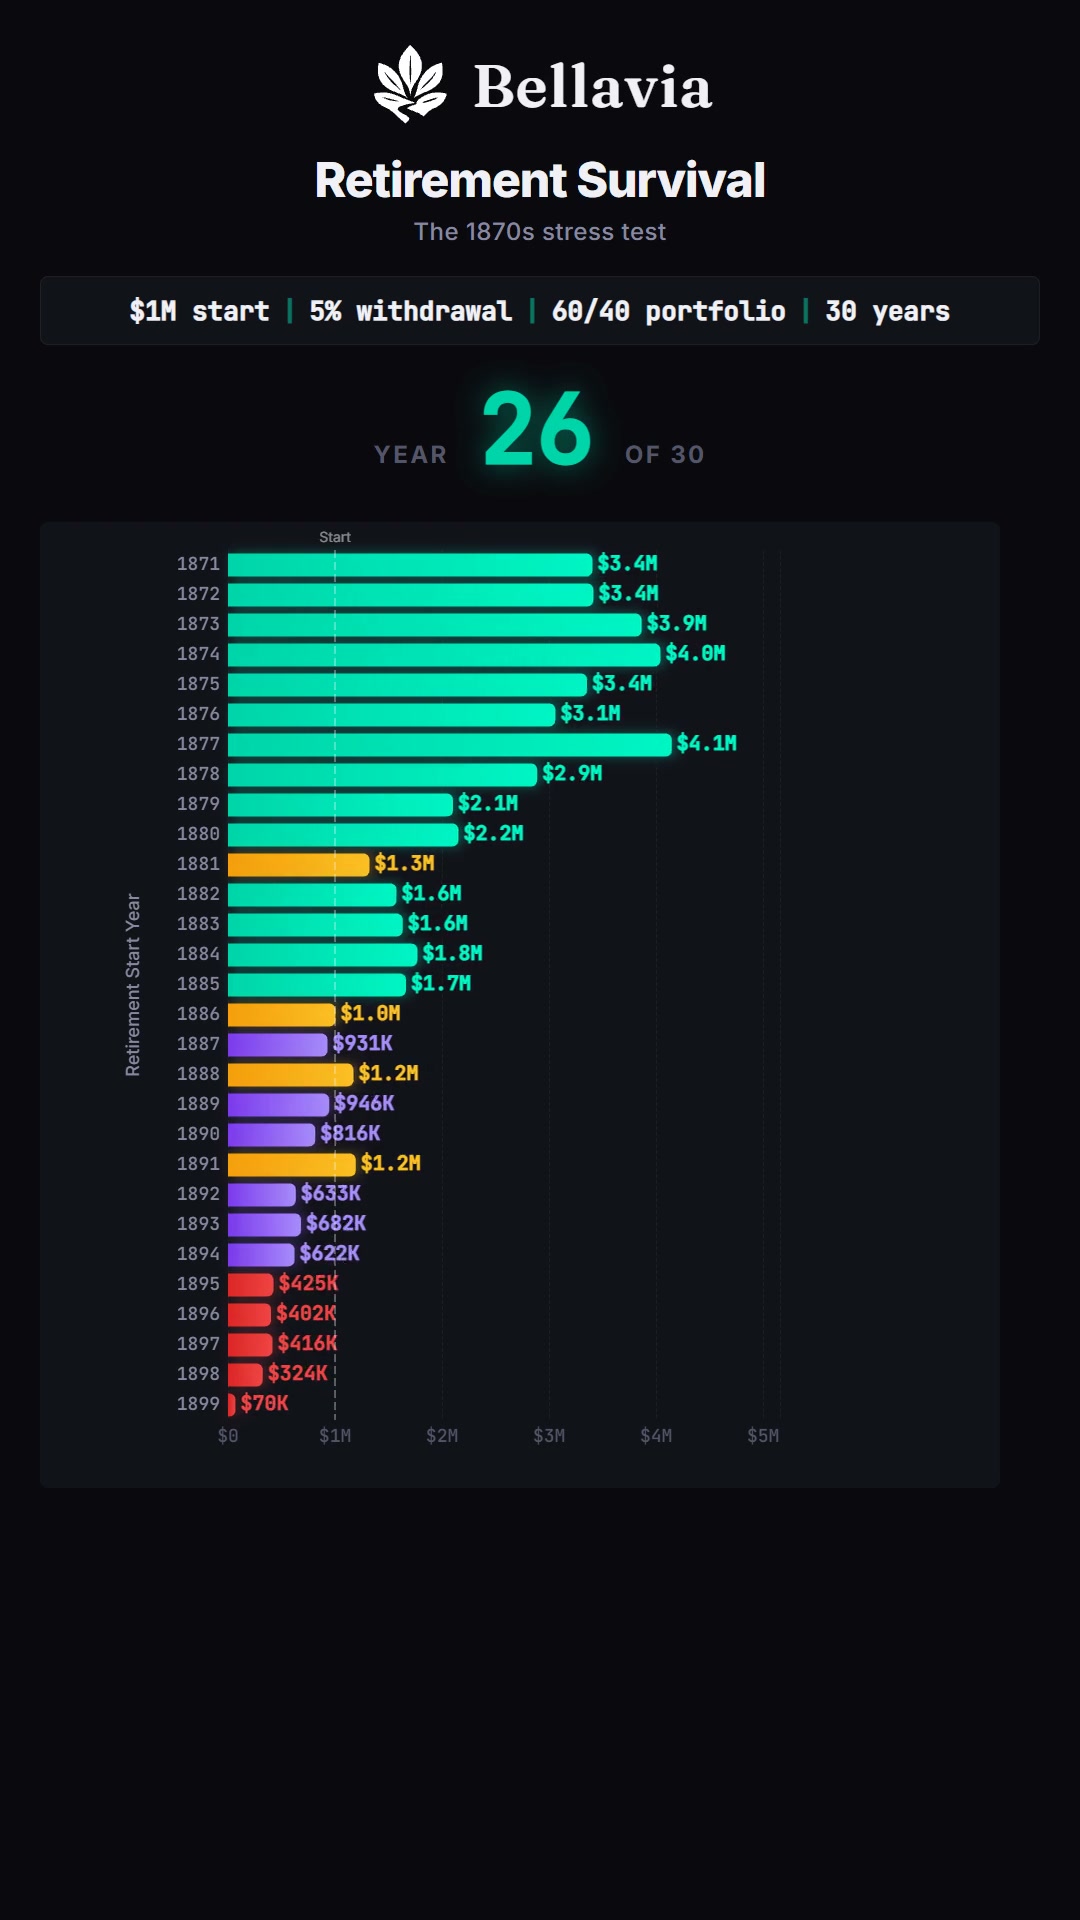
The aggressive 5% withdrawal strategy tested against 100+ years. 85% success rate, but 15% of periods failed. Know your risk.
 Video
Video
Just 0.7% annual inflation for 30 years. $100 became $987 nominally and $812 in real terms. Investors kept 82% of …
 Video
Video
$100 became $3,988 — the single best 30-year stretch in over a century of US market data. 13.1% annualized for …
 Video
Video
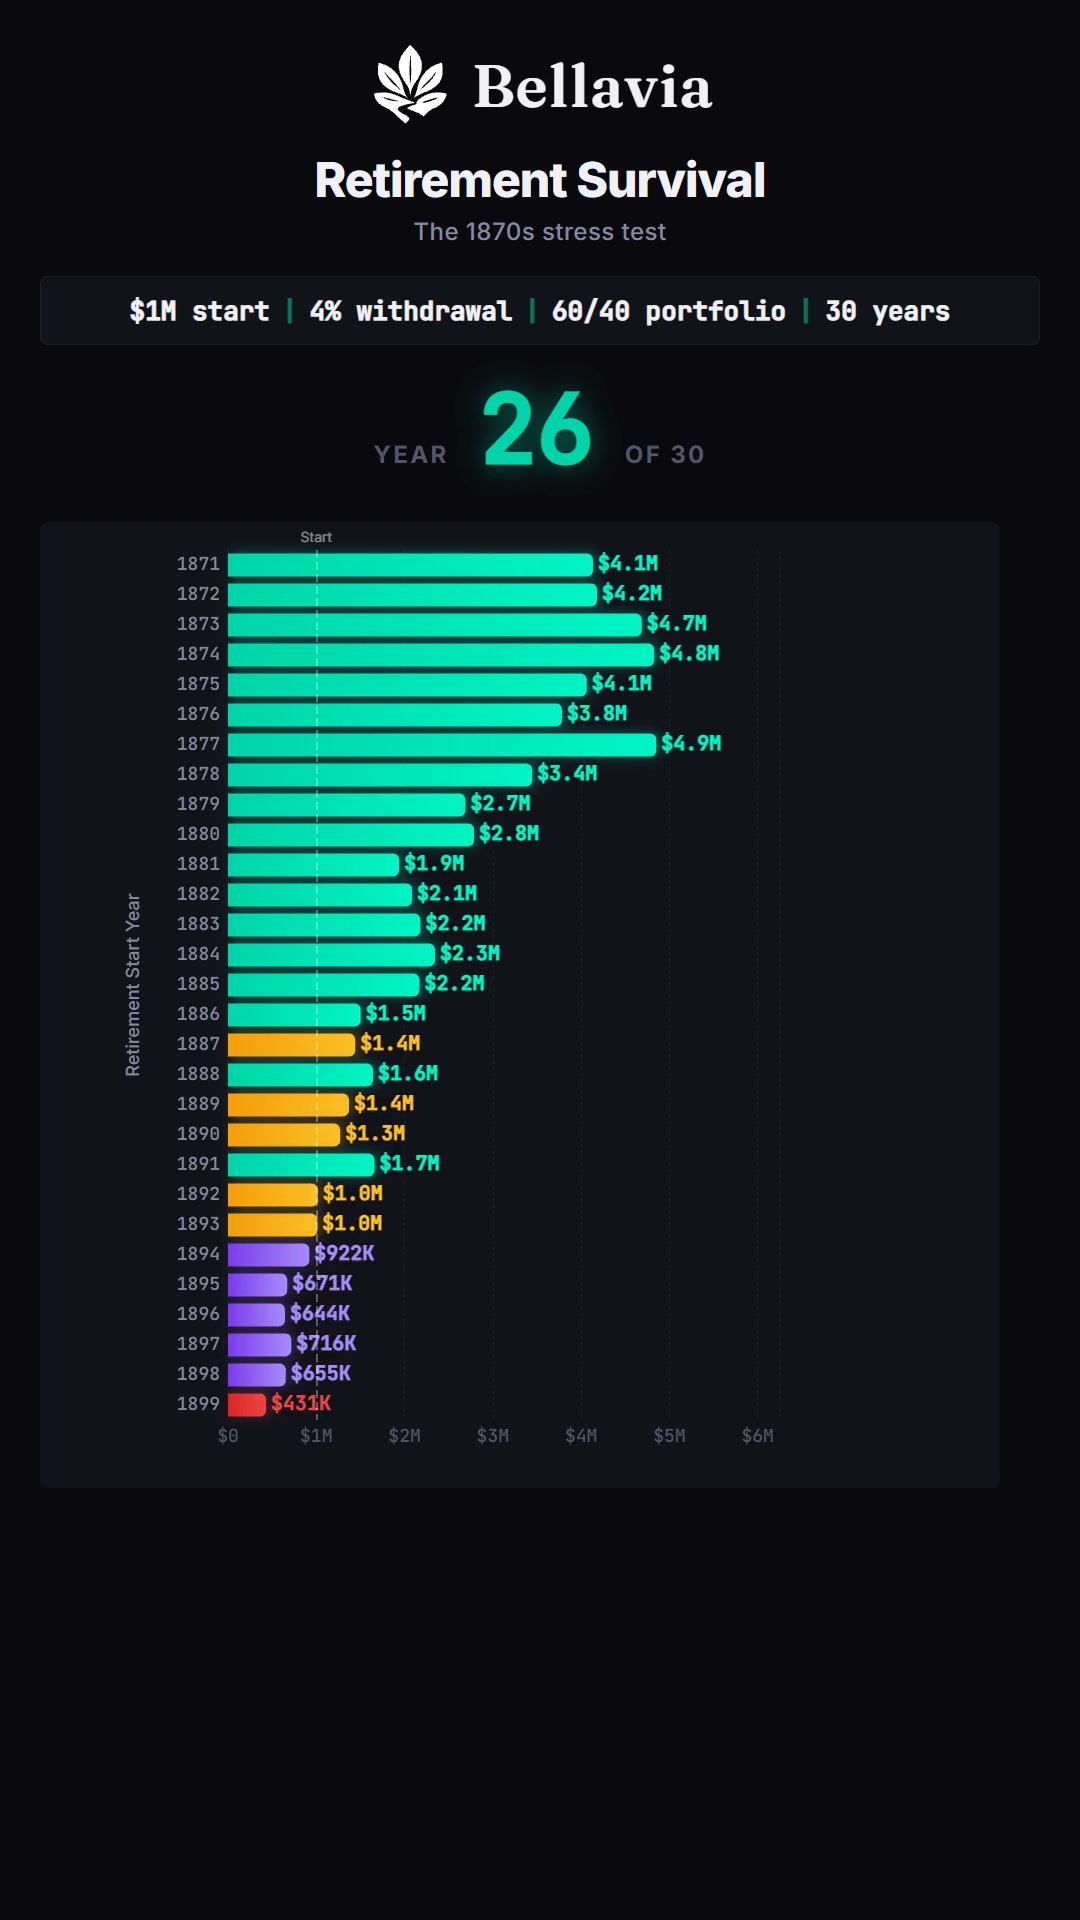
29 retirement cohorts from 1871–1899 at the 4% withdrawal rate. 100% success. Every cohort finished richer than they started.
 Video
Video
$500/month invested through the worst financial crisis in history. You put in $180K. The market turned it into $542K. 3x …
 Video
Video
£100 invested in UK equities in 1900 became just £390 by 1930. Only 4.6% annualized returns. Even Britain’s worst decades …
 Video
Video
£100 in UK stocks grew to £4,395 nominally but was worth only £526 in real terms. 7.3% annual inflation consumed …
 Video
Video
29 retirement cohorts from 1871–1899 race head-to-head at a 5% withdrawal rate. 97% survived. The 1877 cohort finished with $4.4 …
 Video
Video
The best 30-year stretch in UK market history. £100 in UK equities became £7,384 nominally, with 15.4% annualized returns.
 Video
Video
$500/month for 30 years reached $1M in only 1% of historical periods. The median outcome: $521,823. Still nearly 3x your …
 Video
Video
Panics, a world war, the Roaring Twenties bubble, and the Great Crash. Yet $100 still became $507. The S&P 500 …
 Video
Video
$100 became $4,607 nominally but only $1,033 in real terms. The greatest bull market in history still lost 78% of …
 Video
Video
The best time to invest was the worst time to be alive. $100 invested at the bottom of the Great …
 Video
Video
The classic 4% withdrawal strategy tested against every 30-year period in US market history. Only one starting year failed.