
In the last post, I discussed the 3% rule for savings. This is the percentage of your savings goal you should save yearly for 30 years to achieve this goal with a very high chance, historically speaking. I assumed that we invest in a portfolio of 60% equity and 40% bonds, and we rebalance annually. I also assumed that we contribute monthly 1/12 of the yearly amount. The instruments used were the S&P 500 and U.S. Treasuries. In this post, I want to look at how the same strategy would perform in the UK market. To answer this question, we can set up the Bellavia savings calculator as follows.
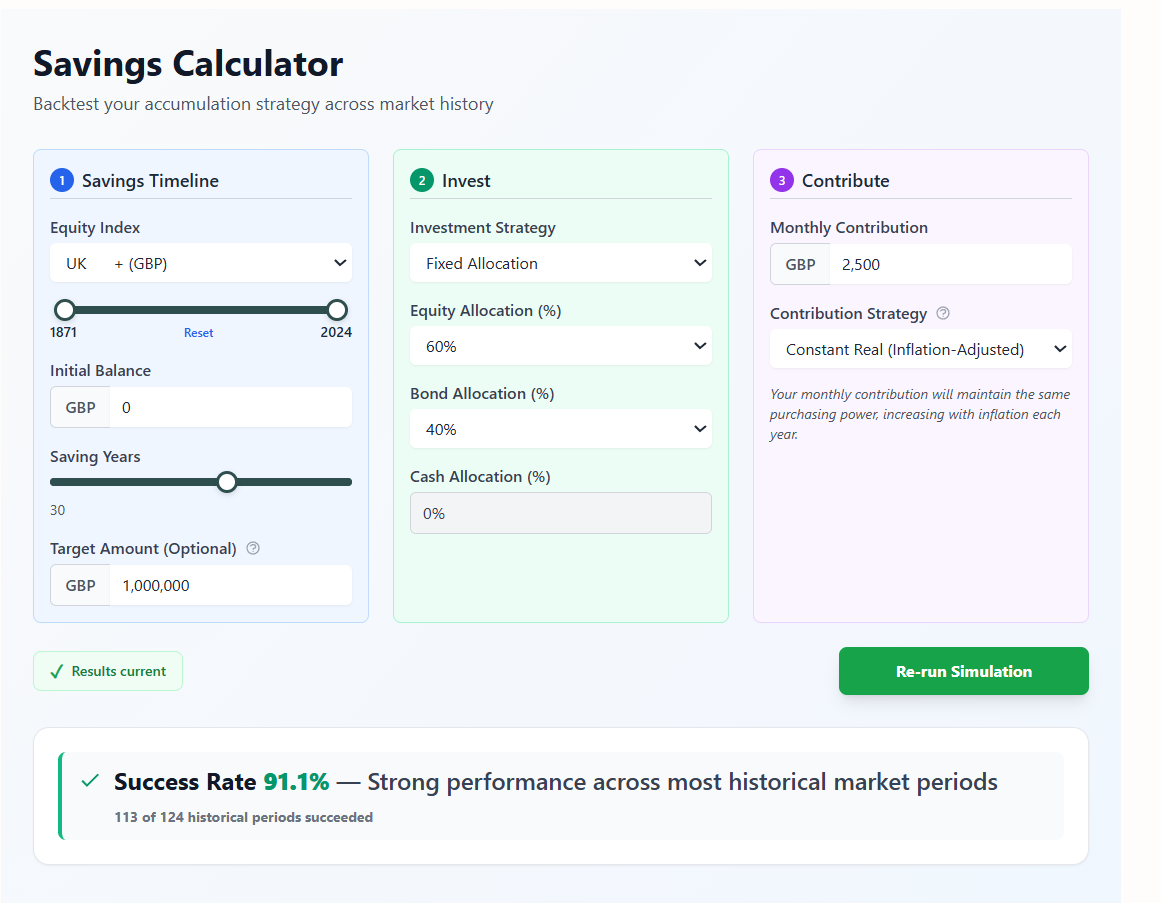
I want to show how the exact strategy would perform when the equity part is a broad UK stock index and the bond part is a broad bond index. As can be seen in Figure 1, the success rate is 91.1%. This is the proportion of 30-year rolling windows that would lead to a full goal. This is lower than the 98.4% of paths that would work out in the US markets, but still good. In general, the lower performance of the UK portfolio is to be expected: The average real 30-year market return over the last 150 years is about 6.7% in the US, while it is 5.2% in the UK. Also, bonds have a 1.3% average 30-year real return in the UK and 2.1% in the US in our data set.
(As an aside, I would also like to think about how these numbers relate to the "usual" savings formula, and I do this in the next post.)
According to the Bellavia Savings Calculator, at the end of this UK historical simulation, the median savings balance was £1.73M.
It is also interesting to observe once again the distribution of possible results:
Figure 2: Historical Savings Paths for 3% savings rate [Created with Bellavia Premium]
As the data shows, there is a significant potential upside to this conservative strategy. Saving £2500/month, the best historical outcome was about £5M for those who started saving in 1969.
At the same time, given that we have some failing periods, I would like to know what these were. What are the failing paths? Do they show any patterns? The timing chart can help here:
Figure 3: Differences in savings against starting year [Created with Bellavia Premium]
As we can see in the above chart, the period between 1886 and 1895 was difficult for savers. Arguably, this was too long ago. Some argue that the structural changes in the national and international environment since then are such that comparisons are not relevant. I would agree that the changes are real, but this is a historical simulation; by definition, it involves different historical conditions that may look unusual. Excluding historical periods whenever we do not like the conclusions is a poor methodology. However, understanding the why and how something happened is a good methodology, and I would like to see what happens if we narrow the data so that it starts from 1900. We can do this using the slider on the savings calculator:
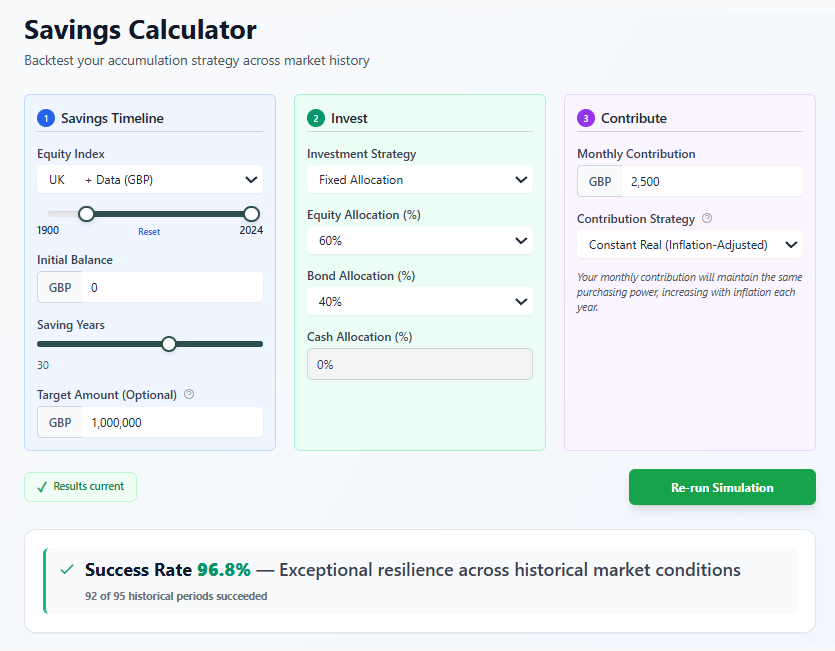
So, if we look at the period after 1900, the success rate jumps to 96.8% and the median savings balance to £1.84M (the median is another standard output on the savings calculator). If we just look separately at the starting years from 1871 to 1900, that is 30, 30-year saving periods, the success percentage was only 73.3%. So, this period played an important role in the overall decrease in the success rate across the 150 years. From a historical perspective, this is related to the great post-WWI recession in the UK. Savers who started in 1886-1895 would finish around 1916-1925 - meaning WWI and the post-war recession hit when their balances were at their largest.
Thinking about how to improve the results, I note that some of the worst periods for a saver's portfolio performance are high inflation periods. So, if we had access to an asset that returns at least as much as inflation, this would have been another way to improve our portfolio. As a thought experiment, assume that we have access to such an asset and we invest 40% of our portfolio in it, leaving the rest in the same equity index. This would move the needle to a 95% success rate. I call this asset "cash", although it is not what we usually mean by cash. Interestingly, a portfolio with this "cash" component outperforms the portfolio with bonds. What assets can play this inflation-protection role is a question for future posts.
In the end, it all boils down to individual planning, risk tolerance and some luck. You can test your numbers by using the Bellavia Savings Calculator:
What does all this mean for a pure UK saver?
- The 3% rule for savings is still a good and conservative guideline
- If, for example, you save even £500/month for 30 years (£180K total contributions), history suggests you'd end up with more than £200K in real terms, with a median around £300K, a significant potential upside.
- If concerned about inflation and market collapse, some type of inflation protection would be beneficial
- Index-linked gilts are one possibility, but for the details of this, you should talk to a financial advisor
References & Sources
Original Retirement Research
The 4% Rule Origins
-
Bengen, W.P. (1994). "Determining Withdrawal Rates Using Historical Data." Journal of Financial Planning, 7(4), 171-180
-
Cooley, P.L., Hubbard, C.M., & Walz, D.T. (1998). Retirement Savings: Choosing a Withdrawal Rate That Is Sustainable (Trinity Study). AAII Journal, February 1998
Accumulation Phase Research
Wade Pfau
-
Pfau, W.D. (2011). Safe Savings Rates: A New Approach to Retirement Planning over the Life Cycle. Journal of Financial Planning, 24(5), 42-50
-
Pfau, W.D. (2012). "Capital Market Expectations, Asset Allocation, and Safe Withdrawal Rates." Journal of Financial Planning, 25(1), 36-43
Sequence of Returns Risk
-
Pfau, W.D. & Kitces, M.E. (2014). Reducing Retirement Risk with a Rising Equity Glide Path. Journal of Financial Planning, 27(1), 38-45
-
Kitces, M.E. (2015). The Ratcheting Safe Withdrawal Rate – A More Dominant Version Of The 4% Rule?
Historical Market Data
-
US Market Data: Robert Shiller's U.S. Stock Markets 1871-Present and CAPE Ratio, Yale University
-
Asset Allocation Research: Vanguard (2024). Principles for Investing Success
-
Òscar Jordà, Katharina Knoll, Dmitry Kuvshinov, Moritz Schularick, and Alan M. Taylor. 2019. “The Rate of Return on Everything, 1870–2015.” Quarterly Journal of Economics, 134(3), 1225-1298.
Join Our Retirement Insights Mailing List
Get exclusive historical analysis and retirement planning insights delivered to your inbox:
- Deep dives into historical market cohorts
- Withdrawal strategy analysis and best practices
- Early access to new features and research
Free insights. Unsubscribe anytime.
Discussion (0)
Join the conversation
Log in to commentNo comments yet. Be the first to share your thoughts!