
As discussed in a recent post, inflation, market performance, and portfolio composition do not affect just retirement portfolios but saving portfolios, too. Following a methodology similar to the one used to derive the 4% rule, but for savings, W. Pfau (2011) calculated a "safe savings rate". That is, a proportion of one's yearly earnings, ignoring tax, fees etc, that would allow the saver after saving for 30 years to replace 50% of his salary for the next 30 years. This savings rate was found to be between 16.62% to 22.15% of salary, that was assumed to stay constant in real terms.
I would like here use Bellavia Analytics to make a similar but distinct calculation, one that is a more direct equivalent to the 4% rate withdrawal rate for retirement portfolios. Specifically, I want to find out how much we need to save on a yearly basis for 30 years in order to have a very high chance, as computed from the available historical record, to hit a specific saving dollar target. To do this I set up the Bellavia savings screen as follows.
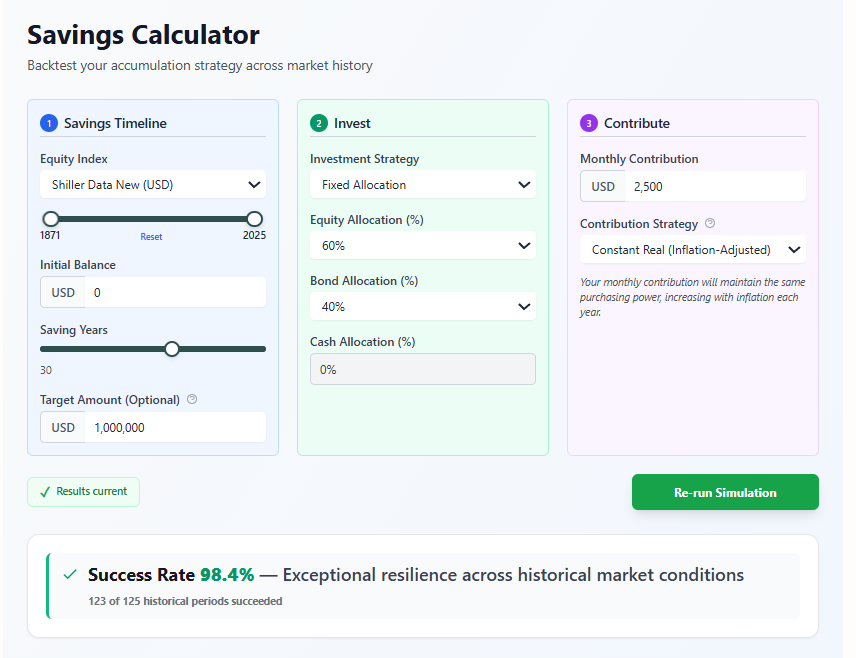
As usual, I assume that we adjust this sum yearly by inflation, so that the contribution remains constant in real terms. I also assume that the money is invested in a portfolio of 60% stock index and 40% bonds. By fixing the target amount and varying the monthly contribution amount, I can see the success rate increasing, as expected. For a target amout of $1,000,000 and a monthly contribution of $2,500 the success rate is 98.4%. In other words, if you want to make sure, in terms of the historical rolling window that you will save $1,000,000 within 30 years, you should be saving about $2,500 per month or 3% of the target amount per year, $30,000, adjusted for inflation. We mean, of course, $1M in real terms, i.e. today's money, and it is true for any amount, proportionally. So, if you plan to save $500K the equivalent monthly savings amount should be $1,250/month etc.
This is what the various saving paths looked historically for this contribution level.
Figure 2: Historical Savings Paths for 3% savings rate [Created with Bellavia Premium]
Hence, we could say that the equivalent of 4% rule for withdrawing has a counterpart of a 3% rule for saving. Still, even with 2.5% per year you would have a more than 95% chance to reach the goal.
The Range of Outcomes
It is interesting to observe the range of possible results of this strategy. Not only do the results vary from $930K to $4M but this 3% proves a very conservative choice. One way to see this is to look at the sums accumulated by this strategy.
Figure 3: Differences in savings against starting year [Created with Bellavia Premium]
We can also consider the median balance following this 3% rule. It is $2.264M. The upper end of the range, savings of more than $4M, would be reached in periods such as between 1970 to 1999. The following table gives a picture of the tradeoff between certainty and contribution size.
| Monthly Contribution | Historical Success Rate | Median Savings |
|---|---|---|
| $2,500 | 98.4% | $2.264M |
| $2,250 | 96.0% | $2.083M |
| $2,000 | 91.2% | $1.811M |
| $1,750 | 87.2% | $1.585M |
| $1,500 | 81.6% | $1.358M |
| $1,250 | 68.0% | $1.132M |
| $1,000 | 37.6% | $0.605M |
Table 1: Historical Success Rate and Median Savings for 30 years of monthly contributions
Thinking of saving goals may be suboptimal in some ways as Pfau (2011) points out. This is because we decouple the saving phase from the retirement phase, when what matters in the end is the lifecycle perspective. You don't just save or just draw, you will be doing both consecutively. Unfortunately, long-term planning is hard enough. Thinking 60 years in the future seems a bit of a stretch, at least for my imagination!
Is there a point in ending up with a lot more savings than are sufficient? This will be the topic of a future post. I will just note that if I am left with excess money at retirement there will likely be plenty of time to spend it. In any case, I believe that thinking about our savings goal in itself adds clarity and realistic expectations. It is particularly important to contemplate the range of outcomes. Eliminating all uncertainty is very costly!
References & Sources
Original Retirement Research
The 4% Rule Origins
-
Bengen, W.P. (1994). "Determining Withdrawal Rates Using Historical Data." Journal of Financial Planning, 7(4), 171-180
-
Cooley, P.L., Hubbard, C.M., & Walz, D.T. (1998). Retirement Savings: Choosing a Withdrawal Rate That Is Sustainable (Trinity Study). AAII Journal, February 1998
Accumulation Phase Research
Wade Pfau
-
Pfau, W.D. (2011). Safe Savings Rates: A New Approach to Retirement Planning over the Life Cycle]. Journal of Financial Planning, 24(5), 42-50
-
Pfau, W.D. (2012). "Capital Market Expectations, Asset Allocation, and Safe Withdrawal Rates." Journal of Financial Planning, 25(1), 36-43
Sequence of Returns Risk
-
Pfau, W.D. & Kitces, M.E. (2014). Reducing Retirement Risk with a Rising Equity Glide Path. Journal of Financial Planning, 27(1), 38-45
-
Kitces, M.E. (2015). The Ratcheting Safe Withdrawal Rate – A More Dominant Version Of The 4% Rule?
Historical Market Data
-
US Market Data: Robert Shiller's U.S. Stock Markets 1871-Present and CAPE Ratio, Yale University
-
Asset Allocation Research: Vanguard (2024). Principles for Investing Success
-
Òscar Jordà, Katharina Knoll, Dmitry Kuvshinov, Moritz Schularick, and Alan M. Taylor. 2019. “The Rate of Return on Everything, 1870–2015.” Quarterly Journal of Economics, 134(3), 1225-1298.
Discussion (0)
Join the conversation
Log in to commentNo comments yet. Be the first to share your thoughts!