Imagine it's January 1936 and you've just retired with £1,000,000 in the UK, a fortune. Suppose you follow today's
"sensible" advice: withdraw 4% annually from your balanced 60/40 portfolio. Fast forward to 1952. You're broke.
Your portfolio ran dry with 14 years of retirement still ahead.
What went wrong? You followed the "safe" 4% rule. The problem? It's an American rule derived from American markets.
Key Findings
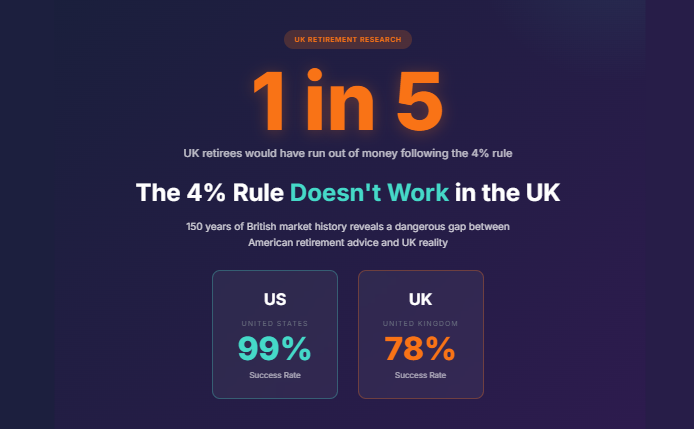
- The 4% rule has only a 78% success rate in UK history (vs. 99% in the US)
- Historically, UK retirees need a ~3.1% withdrawal rate to match US safety levels
- Failures clustered around WWI and WWII, periods of war, inflation, and bond destruction
- The first decade of retirement is critical; poor returns early are often fatal
- Replacing bonds with cash improves the 4% success rate to 90%
In previous posts—here, here, and here—I discussed the famous "4% rule" and how it applied across US history. But the truth is that the 4% rule doesn't travel well. Using Bellavia's analytics and 150 years of UK market data, we can investigate what actually works for British retirees.
The Shocking UK Results
First, let's run the same test as in the US: a £1 million portfolio, 60/40 stocks/bonds (FTSE All Shares and UK Gilts), annual rebalancing, 4% initial withdrawal adjusted for inflation. In the US, this survived ~99% of 30-year retirement periods.
What happened in the UK? The chart below shows the success rate across all possible 30-year retirement windows from 1871 to 2024:
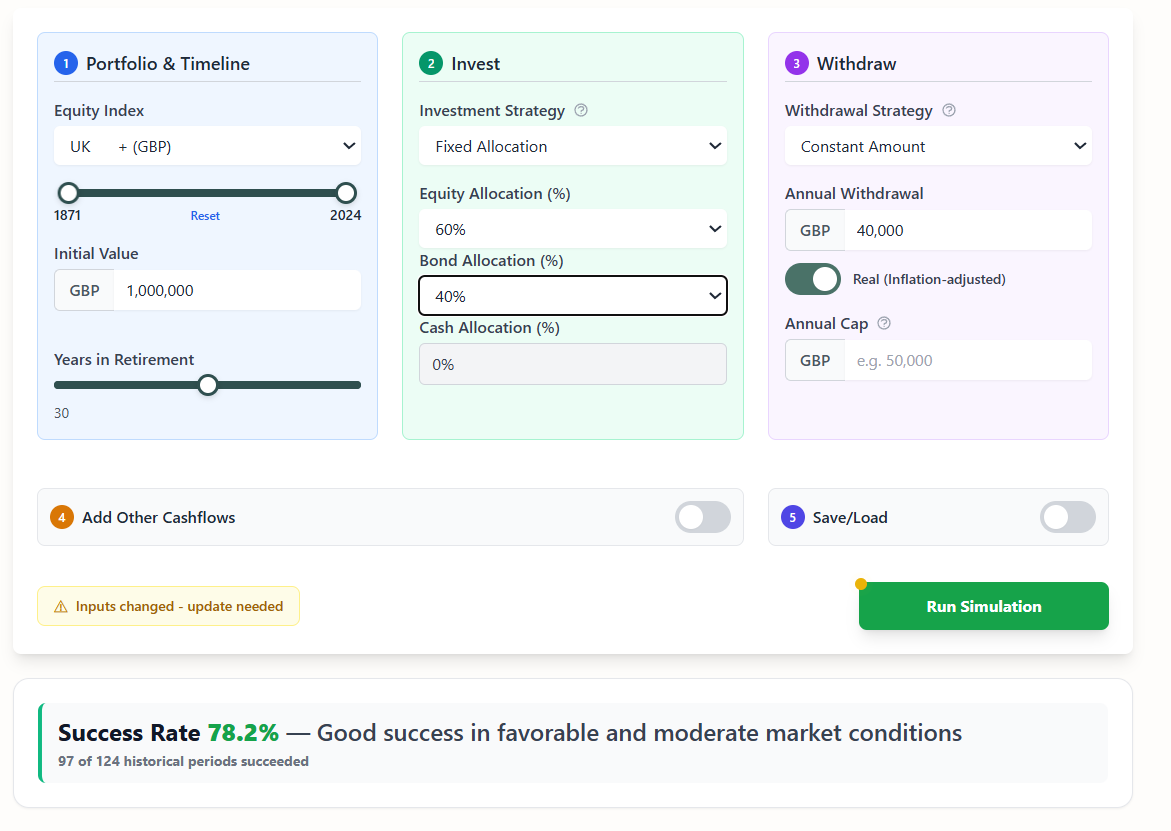
Just 78.2% success. Let that sink in. Following the "safe" 4% rule in the UK meant a 1 in 5 chance of running out of money before you died. Would you board a plane with a 22% crash rate?
Spoiler Alert: Replacing bonds with cash improves this to 90.3%—without cutting your withdrawal rate. More on this below.
US vs UK: A Tale of Two Markets
Why the massive difference? Let's compare directly:
| Metric | United States | United Kingdom |
|---|---|---|
| 4% Rule Success Rate (60/40 portfolio) | ~99% | 78.2% |
| Safe Withdrawal Rate | 4.0% | 3.0% |
| Number of Failures | ~1 out of 100 | 27 out of 124 |
| Worst Failure Periods | 1960s-70s (stagflation) | 1900s-10s, 1930s-40s (world wars) |
| Real Market Returns (CAGR) | ~7% | ~5% |
| Treasury Bills Real Return | +0.5% annually | +1.0% annually |
| Success with 60/0/40 (stocks/bonds/cash) | ~99% | >90% |
The data is clear: what worked in the US didn't work in the UK because the history, and so the markets, were different. The same strategy led to different results.
When British Portfolios Died
Let's look at every possible 30-year retirement window from 1871 to 2024 for the above UK portfolio. Each line below represents one retiree's journey starting in a different year:
Figure 2: 124 historical retirement scenarios from 1871-1994 | £1,000,000 starting balance | 60/40 stocks/bonds [Created with Bellavia]
While some retirees ended with £10+ million, others went bust and the difference was when they retired. Overall, in the UK history 27 out of 124 historical paths failed (21.8%) concentrated in just two starting periods: 1896-1916 and 1936-1945, both coinciding with world wars.
What would you have done if you'd retired in 1936? The following chart shows in a different way how long each portfolio lasted by starting retirement year:
Figure 4: Portfolio longevity by retirement start year [Created with Bellavia]
From a different angle, the following chart shows the distribution of the portfolio failures. Historically, these portfolios started failing at about year 18.
Figure 4: Years when portfolios failed [Created with Bellavia]
What Killed These Portfolios?
War and inflation destroy portfolios. Both risky zones coincided with world wars, eras of massive inflation, depressed markets and a bond market collapse.
During WWI and WWII:
- UK government bonds delivered negative real returns as the government inflated away war debt
- Equities crashed during wartime
- Inflation eroded purchasing power by 50-70%
- The sequence of returns risk—suffering these losses in your first retirement decade—proved fatal
For a 60/40 "balanced" portfolio, both components failed simultaneously. That's not diversification, that's correlation when you need it least.
Morningstar's 2024 analysis found that 70% of retirement plan failures involved losses in the first 5 years of retirement. Conversely, portfolios that gained value in the first 5 years had only a 4% failure rate (1 in 25). After 15 years with no early losses, failure risk dropped to just 1%.
This research validates what UK historical data above shows: the 1936 retirees who failed didn't just experience poor returns—they experienced them at the worst possible time, right at retirement. Once portfolios were depleted by early war-era losses, there wasn't enough capital left to benefit from post-war recovery.
The Real UK Safe Withdrawal Rate: 3%
So if 4% is risky, what actually works? Let's test a 3% withdrawal rate:
✅ 99.2% success rate—finally matching US performance, but requiring 25% lower withdrawals.
So, the UK equivalent of the 4% rule is the 3% rule. Not as catchy, but it would have kept you solvent through both world wars.
Figure 5: Portfolio longevity with 3% withdrawal rate [Created with Bellavia]
The portfolio failure zones almost disappear. Just one such path remains (the one starting in 1936). Everything else survives. That's what safety looks like in the historical record.
The Cash Alternative: A Surprising Solution
But what if you don't want to cut your withdrawals by 25%? Is there another way?
Here's a counterintuitive finding: replace your bonds with cash (Treasury bills).
Cash instead of bonds? That's crazy! But the data says otherwise. For the purposes of this post, we're defining "cash" as an instrument returning CPI + 0% real return.
There is an additional advantage in this definition: it is easy to implement in Bellavia if in your market data
you set the cash_TR column equal to CPI. Alternatively, you could set it to actual historical Treasury bill returns for a more accurate
result.
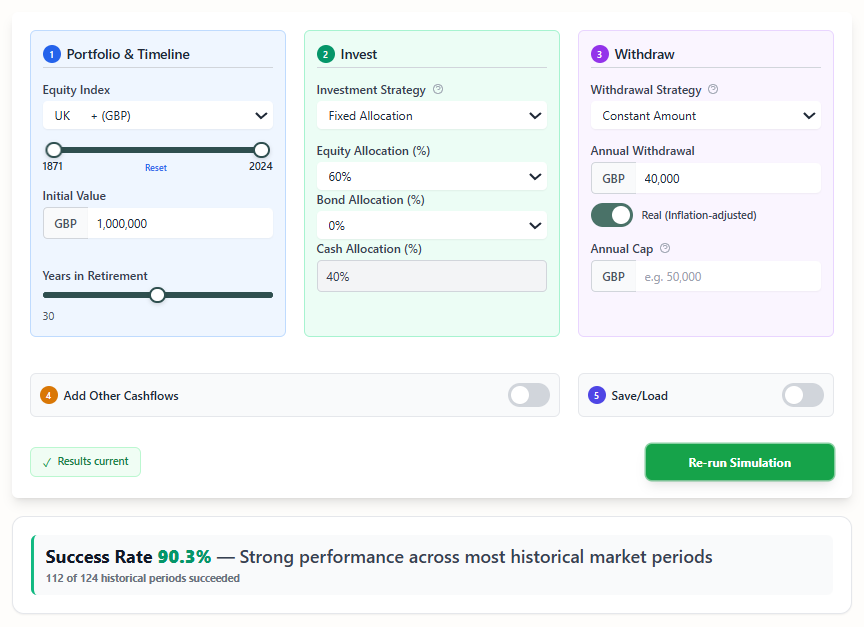
90.3% success rate—a 12-percentage-point improvement while keeping the 4% withdrawal. Not quite the 99% of the 3% rule, but dramatically better than the original 78%.
Why does this work? During the war periods, UK gilts got hammered both by inflation and financial underperformance. Treasury bills, while still losing to inflation, lost less and recovered faster. Over the full 150-year period, bills delivered positive real returns, making our CPI-matching assumption conservative. The resilience of cash during inflationary crises proved crucial for portfolio survival.
What This Means for Today
"Okay, interesting history lesson. But we are not retiring in 1936. Why should we care?"*
Here's why this matters for modern UK retirees:
-
The 3% rule is a historical safety net: If you want 99%+ historical confidence, plan for 3% withdrawals, not 4%. Yes, that means saving more or retiring later.
-
Bonds aren't always "safe": During inflation and financial repression, UK gilts can underperform even cash. We do not need to blindly follow the 60/40 gospel. More on this in future posts.
-
Sequence risk is critical: The first decade of retirement determines the fate of the portfolio. Morningstar research confirms this: 70% of plan failures involved losses in the first 5 years. A 2008-style crash in year 1 can be unrecoverable. A crash in year 20 barely matters.
-
The "Retirement Window" is critical: BlackRock identifies ages 55-70 as a period of heightened uncertainty, what they call the "Retirement Window." Their 2024 survey found 60% of pre-retirees worry about outliving their savings, and 80% say these concerns affect their mental health. This isn't just about numbers on a spreadsheet, it's about peace of mind. Getting your withdrawal rate right matters for your psychological well-being, not just your bank balance.
-
Test YOUR specific situation: Your asset allocation, timeline, pension income, and spending flexibility all matter. Generic rules don't cut it.
Has anything changed structurally? UK gilt markets are different today than they were during the war eras. Inflation dynamics have evolved. But the fundamental lesson remains: American retirement rules don't work in British markets. You need UK-specific analysis.
The Bottom Line
The "4% rule" is brilliant in its simplicity but it is dangerous financial planning for UK retirees. The data across 150 years of market history shows:
- The 3% rule (with 60/40 stocks/bonds) achieves 99% safety, matching US performance
- A 60/0/40 stocks/cash portfolio with 4% withdrawals achieves 90% safety, that is historically better than bonds but not as safe as cutting withdrawals
- The 4% rule with bonds? 78% success—unacceptably risky for many of us
- Failures clustered in war/inflation periods when both stocks and bonds collapsed
Don't let someone else's market history determine your retirement safety.
References & Sources
Sequence of Returns Risk Research
Morningstar - How to Avoid Outliving Your Retirement Savings? It's All in the Sequence (2024) - Reevaluating the 4% Withdrawal Rule (December 2024)
BlackRock - Navigating the Retirement Window (2024) - 2024 Read on Retirement Survey (2024)
Charles Schwab - Longevity Risk: Could You Outlive Your Savings? (2024)
Historical Data
-
Òscar Jordà, Katharina Knoll, Dmitry Kuvshinov, Moritz Schularick, and Alan M. Taylor. 2019. “The Rate of Return on Everything, 1870–2015.” Quarterly Journal of Economics, 134(3), 1225-1298.
Find YOUR safe withdrawal rate in 60 seconds
Try Bellavia's UK portfolio analyzer with your exact allocation, timeline, and income sources. See how your specific plan would have performed across 150 years of UK market history—including the 1936 crisis, WWI, WWII, and the 2008 crash.
Test your retirement plan before you bet your future on it.
Discussion (0)
Join the conversation
Log in to commentNo comments yet. Be the first to share your thoughts!