The Useless "Rules of Thumb"
Search for retirement advice and you'll come across the same generic answers everywhere: the 4% rule says your $1 million should last 30 years.
But this assumes:
- You have a 60/40 stock/bond portfolio
- You withdraw exactly 4% adjusted for inflation
- You experience average U.S. market conditions
- You retire for exactly 30 years
But your situation is not average. You might retire at 55 or 70. You might need $30,000 or $80,000 per year. You might hold 80% stocks or 30% stocks. You might face the next Great Depression or the next bull market.
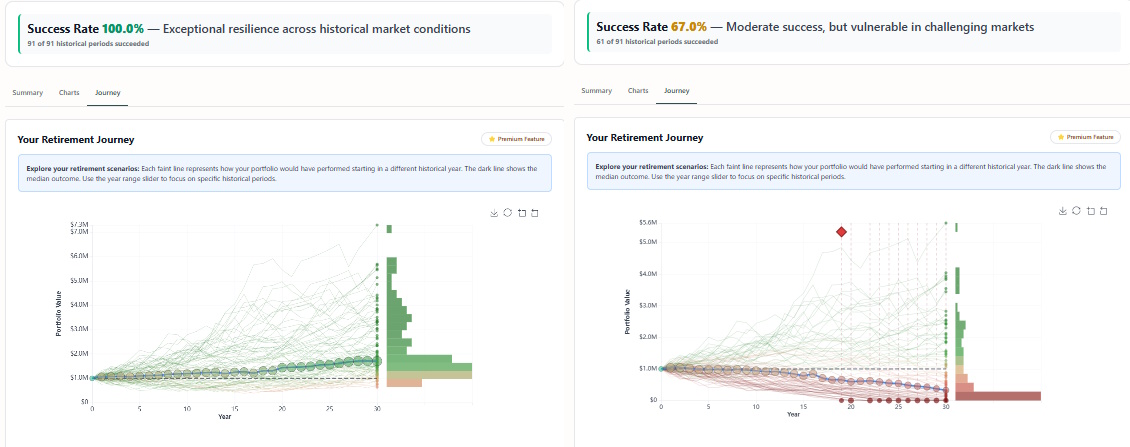
Most retirement calculators give you one answer based on assumptions you didn't choose. They can't show you what happened to real portfolios during real market crashes. They can't let you test YOUR specific withdrawal rate with YOUR specific allocation during specific historical periods.
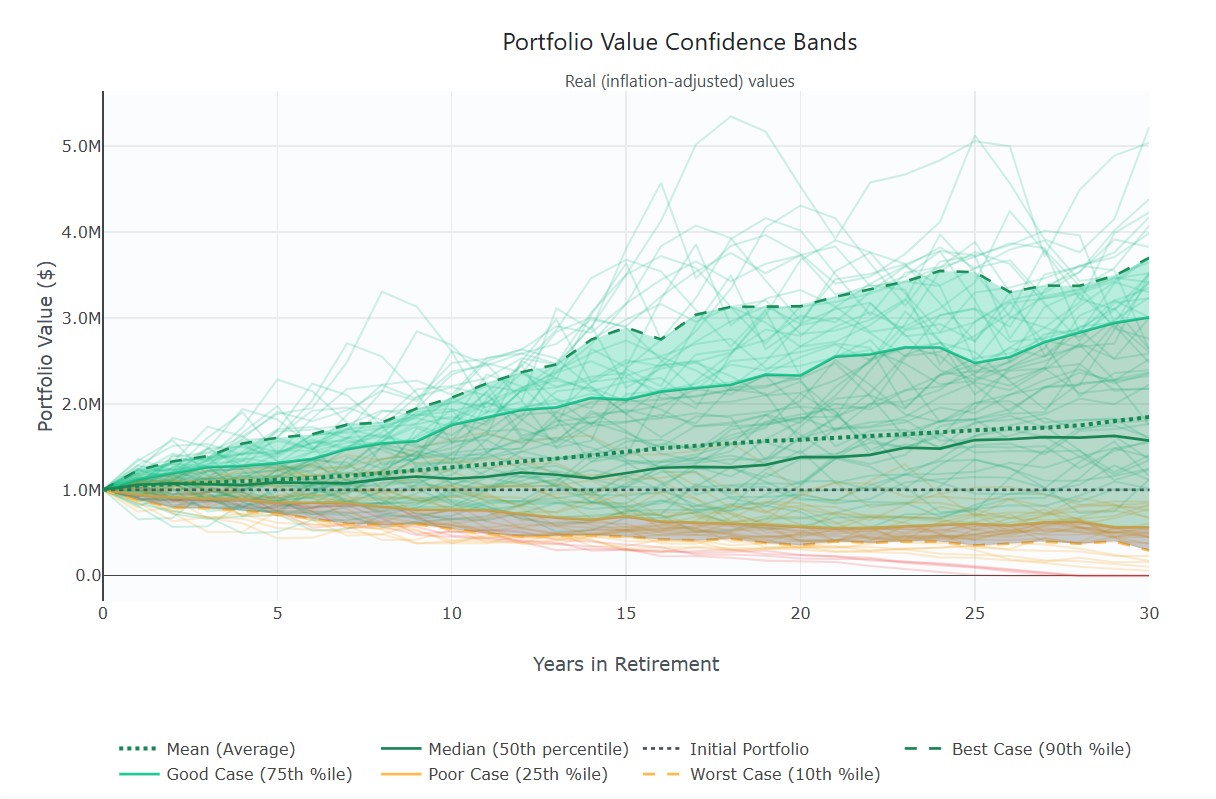
That's why we built Bellavia differently. Enter your actual numbers, choose your actual allocation, and see what would have happened across more than a century of market history.
The 4 Variables That Actually Matter
How long $1 million lasts depends on four variables. Change any one of them and your outcome changes dramatically.
Variable 1: Your Withdrawal Rate
This is the most important variable. It's the difference between running out in 15 years or having money left after 40.
| Annual Withdrawal | Withdrawal Rate | Typical Outcome (30 Years) |
|---|---|---|
| $30,000 | 3.0% | Very Safe - Almost always survives |
| $40,000 | 4.0% | Usually Safe - Very high success rate (often >90%) |
| $50,000 | 5.0% | Risky - Moderate success rate, maybe about 70% |
| $60,000 | 6.0% | Very Risky - 50% success rate, perhaps lower |
| $80,000 | 7.0% | High Risk - Portfolio can deplete in 12-15 years |
Notice the pattern here: every additional 1% of withdrawal rate significantly reduces your chances of success. Going from 4% to 6% doesn't just reduce your portfolio lifespan by a third, it multiplies your risk of running out of money.
Look for example at possible outcomes for otherwise equal 30-year retirement portfolios depending on the constant, inflation-adjusted withdrawal rate:
Variable 2: Your Asset Allocation
The mix of stocks, bonds, and cash in your portfolio dramatically affects both your upside potential and your downside risk.
More stocks = Higher long-term returns BUT more volatility and higher risk during market crashes
More bonds = Lower volatility and better protection during crashes BUT lower long-term returns
More cash = Maximum safety BUT guaranteed purchasing power loss due to inflation
For a $1 million portfolio with $40,000 annual withdrawals (4%), here's how different allocations historically performed:
- 100% Stocks (100/0/0): Highest upside but dangerous sequence risk. If you retire into a crash, you could run out in 20 years. If you retire into a bull market, you might have $3 million after 30 years.
- 80% Stocks / 20% Bonds (80/20/0): Still aggressive but with some cushion during downturns. Historically performed well for retirees with 30+ year horizons.
- 60% Stocks / 40% Bonds (60/40/0): The "traditional" retirement allocation. Balances growth and safety. This is what most 4% rule studies assume.
- 40% Stocks / 60% Bonds (40/60/0): Conservative. Provides stability but may struggle to keep pace with inflation over 30+ years.
- 20% Stocks / 80% Bonds (20/80/0): Very conservative. Minimal volatility but very limited growth potential.
There's no "best" allocation. It depends on your risk tolerance, time horizon, and withdrawal needs. Someone retiring at 50 needs more growth potential than someone retiring at 70.
Variable 3: When You Retire (Sequence Risk)
This is the variable you can't control, but it matters enormously. Two people with identical portfolios, identical withdrawals, and identical allocations can have completely different outcomes based solely on WHEN they retire.
- Started with $1 million (inflation-adjusted)
- Withdrew 4% = $40,000/year
- Had a balanced 60/40 portfolio
- Result: Portfolio depleted in year 28
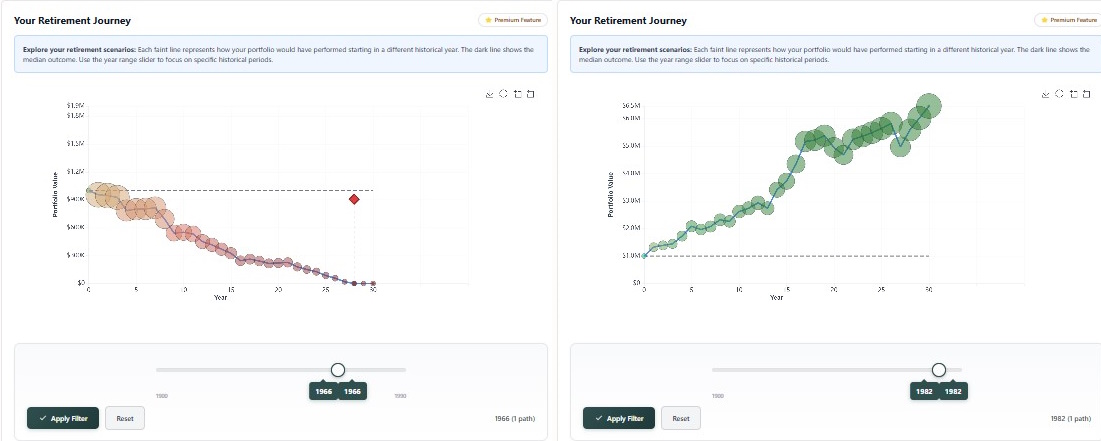
Why? They retired right before the 1970s stagflation crisis. Poor returns plus high inflation decimated their portfolio during the critical early years.
- Started with $1 million (inflation-adjusted)
- Withdrew 4% = $40,000/year
- Had a balanced 60/40 portfolio
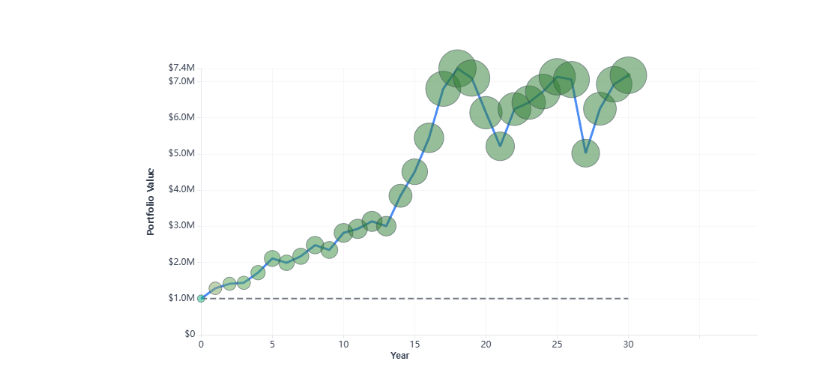
- Result: Portfolio grew to over $2.5 million by year 30
Why? They retired at the start of one of the greatest bull markets in history. Strong early returns gave their portfolio a cushion that lasted decades.
This is called sequence of returns risk. The order in which you experience market returns matters more than the average return over time.
If you experience strong returns early in retirement, your portfolio builds a cushion that helps weather later downturns. If you experience poor returns or a crash early in retirement, you're forced to sell stocks at depressed prices, permanently reducing your portfolio size.
You can't control when you retire relative to market cycles. But you CAN test how your portfolio would have performed during different historical periods to understand your range of outcomes.
Variable 4: Inflation
Inflation is the silent killer of retirement portfolios. That $40,000 you need today won't buy the same amount in 20 years.
| Inflation Rate | $40,000 Today Becomes... | After 20 Years |
|---|---|---|
| 2% (Low) | $59,438 | 49% increase needed |
| 3% (Historical Average) | $72,244 | 81% increase needed |
| 4% (Moderate) | $87,645 | 119% increase needed |
| 6% (High) | $128,286 | 221% increase needed |
At 4% inflation, you need to more than double your dollar withdrawals over 30 years just to maintain the same standard of living. This is why having some equity exposure is critical—bonds and cash can't keep pace with even moderate inflation over long periods.
The U.S. experienced unusually high inflation in 2021-2023 (peaking above 9%). While it has since moderated, this serves as a reminder that decades of low inflation can end abruptly. The 1970s saw similar persistent high inflation that devastated fixed-income retirees.
Real Examples from History
Let's look at three actual historical scenarios and how a $1 million portfolio with $40,000 annual withdrawals (4%) could have fared.
Example 1: The Conservative Retiree (1929)
Scenario: Retired right before the Great Depression
Portfolio: $1 million, 40/60 allocation (conservative)
Withdrawal: $40,000/year adjusted for inflation
Outcome: Portfolio lasted 35+ years despite the worst market crash in modern history
Why it worked: The conservative allocation protected against the worst of the crash. Lower withdrawals relative to bonds provided stability. Deflation during the Depression actually increased purchasing power.
Example 2: The Unlucky Aggressive Retiree (2000)
Scenario: Retired at the peak of the dot-com bubble
Portfolio: $1 million, 80/20 allocation (aggressive)
Withdrawal: $40,000/year adjusted for inflation
Outcome: Portfolio struggled significantly, came close to depletion around year 20
Why it struggled: Two major crashes within 8 years (2000-2002 and 2008-2009). High equity allocation meant maximum exposure to both crashes. Forced to sell stocks at depressed prices to fund living expenses.
Example 3: The Lucky Retiree (2009)
Scenario: Retired at the bottom of the Financial Crisis
Portfolio: $1 million, 60/40 allocation (balanced)
Withdrawal: $40,000/year adjusted for inflation
Outcome: Portfolio more than doubled by year 15
Why it thrived: Perfect timing—bought at the bottom and rode one of the longest bull markets in history. Portfolio had strong early returns that compounded over time.
The Factors that complicate planning
Beyond the four main variables, several other factors significantly impact how long $1 million will last:
Healthcare Costs
Fidelity estimates that a 65-year-old couple retiring in 2024 will need approximately $315,000 to cover healthcare costs in retirement. That's above and beyond your $40,000 or $60,000 annual living expenses.
Healthcare inflation also runs higher than general inflation—typically 5-7% annually vs. 2-3% for general expenses. This means healthcare costs compound faster than your other expenses.
Longevity (How Long You Actually Live)
The 4% rule and most retirement planning assumes a 30-year retirement. But:
- A healthy 65-year-old has a good chance of living to 90+ (25-30 year retirement)
- If you retire at 60, you might need 35+ years of income
- If you retire at 55, you might need 40+ years of income
- For couples, at least one spouse often lives well into their 90s
Planning for 30 years might not be enough if you're healthy and retire early.
Spending Patterns (The Retirement Spending Smile)
Research shows retirees don't spend the same amount every year. Spending typically follows a "smile" pattern:
- Ages 65-75: Higher spending (travel, activities, "go-go years")
- Ages 75-85: Lower spending (less travel, "slow-go years")
- Ages 85+: Higher spending again (healthcare, assistance, "no-go years")
A fixed withdrawal strategy doesn't account for this natural variation in spending needs.
Social Security and Other Income
If you'll receive Social Security, pension income, or rental income, you need less from your portfolio. For example:
- If you need $60,000/year total income
- And you'll receive $20,000/year from Social Security
- You only need $40,000/year from your portfolio
- This dramatically improves your portfolio longevity
Every $10,000 of external income is like having $250,000-$333,000 more in your portfolio (using the 3-4% rule).
Legacy Goals
Do you want to leave money to heirs or charity? If so, planning to deplete your portfolio to $0 isn't appropriate. You might target having $500,000 or $1 million remaining—which means you need to withdraw less during your lifetime.
Stop Guessing. Here's How to Know YOUR Numbers
Generic articles can't tell you how long $1 million will last for YOU because they don't know:
- Your actual annual spending needs
- Your actual asset allocation
- Your actual retirement timeline
- Your actual risk tolerance
- Your actual flexibility to cut spending if needed
Bellavia solves this by letting you input YOUR specific numbers and test them against real historical market data.
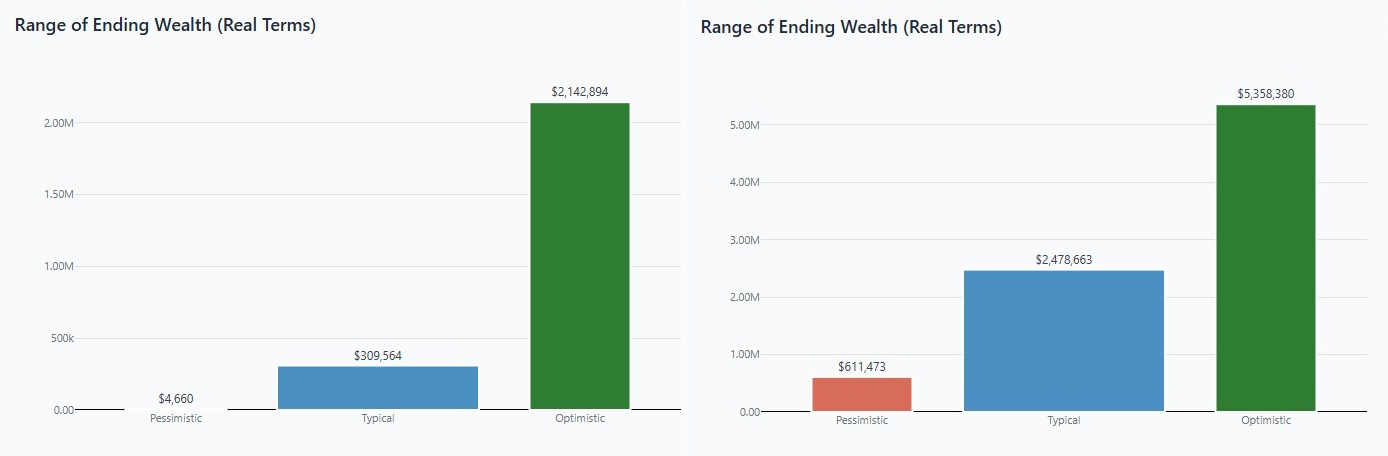
- Best case: Your $1 million under ideal conditions (like retiring in 1982)
- Worst case: Your $1 million under the worst 30-year period in history
- Possible range: What happened across all historical periods
- Your scenarios: Adjustable—test specific decades, market conditions, or custom data
Instead of one answer based on assumptions you didn't choose, you get a range of outcomes based on what actually happened in history. Then YOU decide if you're comfortable with that range.
What If $1 Million Isn't Enough?
If Bellavia shows your portfolio running out before your target retirement horizon, you have several options:
Option 1: Retire Later
Every additional year you work has a triple benefit:
- One more year of portfolio growth
- One more year of contributions
- One fewer year of withdrawals
Delaying retirement from 65 to 67 (just two years) can improve your portfolio longevity by 5-10 years.
Option 2: Reduce Spending
Even a 10-20% spending reduction makes a massive difference. Reducing from $60,000/year to $50,000/year (17% cut) can extend your portfolio life by 10+ years in many scenarios.
Option 3: Work Part-Time Initially
Working part-time for the first 3-5 years of retirement, even just earning $15,000-$20,000/year, can dramatically reduce sequence of returns risk. You're withdrawing less from your portfolio during the critical early years.
Option 4: Be Flexible with Spending
Instead of fixed withdrawals, use a dynamic strategy:
- In good market years, withdraw more
- In bad market years, withdraw less
- This "guardrails" approach historically allows 20-30% higher lifetime withdrawals
Bellavia lets you test these different withdrawal strategies to see which might work best for your situation.
Option 5: Adjust Your Asset Allocation
If you're running out with a conservative allocation, consider more equities. Yes, this increases volatility, but if your alternative is running out of money, the long-term growth potential of stocks might be worth the risk.
Conversely, if you're taking too much risk and suffering from sequence risk, a more conservative allocation might actually improve your outcomes despite lower expected returns.
Beyond $1 Million: How Much Do You Actually Need?
The "$1 million question" is popular because it's a nice round number. But it might not be the right number for you.
You can use this quick formula to estimate your retirement number:
- Need $40,000/year? Target $1 million ($40K × 25)
- Need $60,000/year? Target $1.5 million ($60K × 25)
- Need $80,000/year? Target $2 million ($80K × 25)
- Need $100,000/year? Target $2.5 million ($100K × 25)
This assumes the 4% rule. If you want to be more conservative (3% withdrawal rate), multiply by 33 instead of 25. If you're comfortable with more risk (5% withdrawal rate), multiply by 20.
But remember: this is just a starting estimate. The best way to estimate if it's enough is to test it against real historical scenarios with your specific allocation and withdrawal pattern.
The Research Behind Retirement Planning
The retirement planning principles discussed in this article are based on decades of academic research:
Foundational Studies:
- Bengen (1994): "Determining Withdrawal Rates Using Historical Data" - Journal of Financial Planning
- Trinity Study (1998): "Retirement Savings: Choosing a Withdrawal Rate That Is Sustainable" - Cooley, Hubbard & Walz
Key Research on Sequence Risk and Dynamic Strategies:
- Pfau (2010): "An International Perspective on Safe Withdrawal Rates" - Journal of Financial Planning
- Blanchett (2014): "Exploring the Retirement Consumption Puzzle" - Journal of Financial Planning
- Finke, Pfau & Williams (2012): "Spending Flexibility and Safe Withdrawal Rates" - Journal of Financial Planning
Data Sources:
- Historical U.S. market data: Robert Shiller's stock market database (1871-present)
- Global market data: JST Macrohistory Database, Global Financial Database
- Inflation data: Bureau of Labor Statistics CPI data
For more detailed analysis of the 4% rule and its limitations, see our companion article: The 4% Rule: Why the Creator Says His Own Formula Is Wrong
The Real Answer: A lot Depends On You
How long $1 million lasts in retirement depends on:
- When you retire
- How much you spend
- How you invest
- What markets do
- How long you live
- Your flexibility to adjust
Stop reading generic articles. Put YOUR numbers in the calculator. Test YOUR retirement date against actual market history.
See exactly how long your $1 million would last.
Frequently Asked Questions
Can I retire at 60 with $1 million?
It depends on your spending. If you need $40,000/year or less, historically yes—most scenarios show the portfolio lasting 30+ years. If you need $70,000+ per year, it becomes much riskier, especially if you face poor market returns early in retirement. Test your specific scenario with Bellavia to see the range of outcomes.
How much do I need to retire at 50?
Multiply your annual spending by 30-40. If you need $50,000/year, target $1.5-2 million. Retiring at 50 means potentially 40-45 years of retirement, which requires more conservative planning than retiring at 65. You'll also need to bridge healthcare coverage until Medicare eligibility at 65.
What's the safest withdrawal rate from $1 million?
Historically, 3-3.5% has almost never failed over 30 years, even in the worst market conditions. That's $30,000-$35,000 per year from $1 million. The traditional 4% ($40,000/year) has a 85-95% historical success rate. Higher withdrawal rates increase risk significantly. But "safest" depends on your risk tolerance and flexibility.
Should I count Social Security when planning?
Yes, absolutely. Social Security dramatically reduces how much you need from your portfolio. If you need $60,000/year total and receive $24,000 from Social Security, you only need $36,000 from your portfolio. This is like having $600,000-$900,000 more in portfolio assets. Check your estimated benefit at ssa.gov.
Is $1 million enough to retire in 2024?
It depends entirely on your spending and retirement age. For someone needing $40,000/year, $1 million can work. For someone needing $80,000/year, it's likely not enough. In 1994, $1 million was top 1% wealth. Today it's roughly top 10%—still substantial but not as comfortable as it once was. The real question isn't whether $1 million is "enough" generally, but whether it's enough for YOUR specific situation. Run the numbers to find out.
Ready to Test Your Million?
You've read the theory. Now run your actual numbers. See what would happen to your $1 million portfolio across the best and worst market periods in history. No generic assumptions—just YOUR specific scenario tested against real data.
Start Your Analysis Now →14-day free trial available
Related Reading
For more detailed retirement planning guidance, check out these related articles:
- The 4% Rule: Why the Creator Says His Own Formula Is Wrong
- How to Upload Historical Market Data to Test Your Retirement Plan
Discussion (0)
Join the conversation
Log in to commentNo comments yet. Be the first to share your thoughts!