Come retirement day, most of us start with a given sum of money that we need to manage to get the most from our savings. What we try to do with Bellavia is investigate possible scenarios and strategies to achieve this goal, and then backtest these against real historical data.
There are many choices on how to go about it, and in this post, we try to explain them. The basic assumption behind all this is that our fund will be invested in a mixture of three assets:
- A broad equity index, which provides growth
- A bond component, which provides long-term stability
- A cash component, which provides immediate access
This is a typical portfolio allocation.
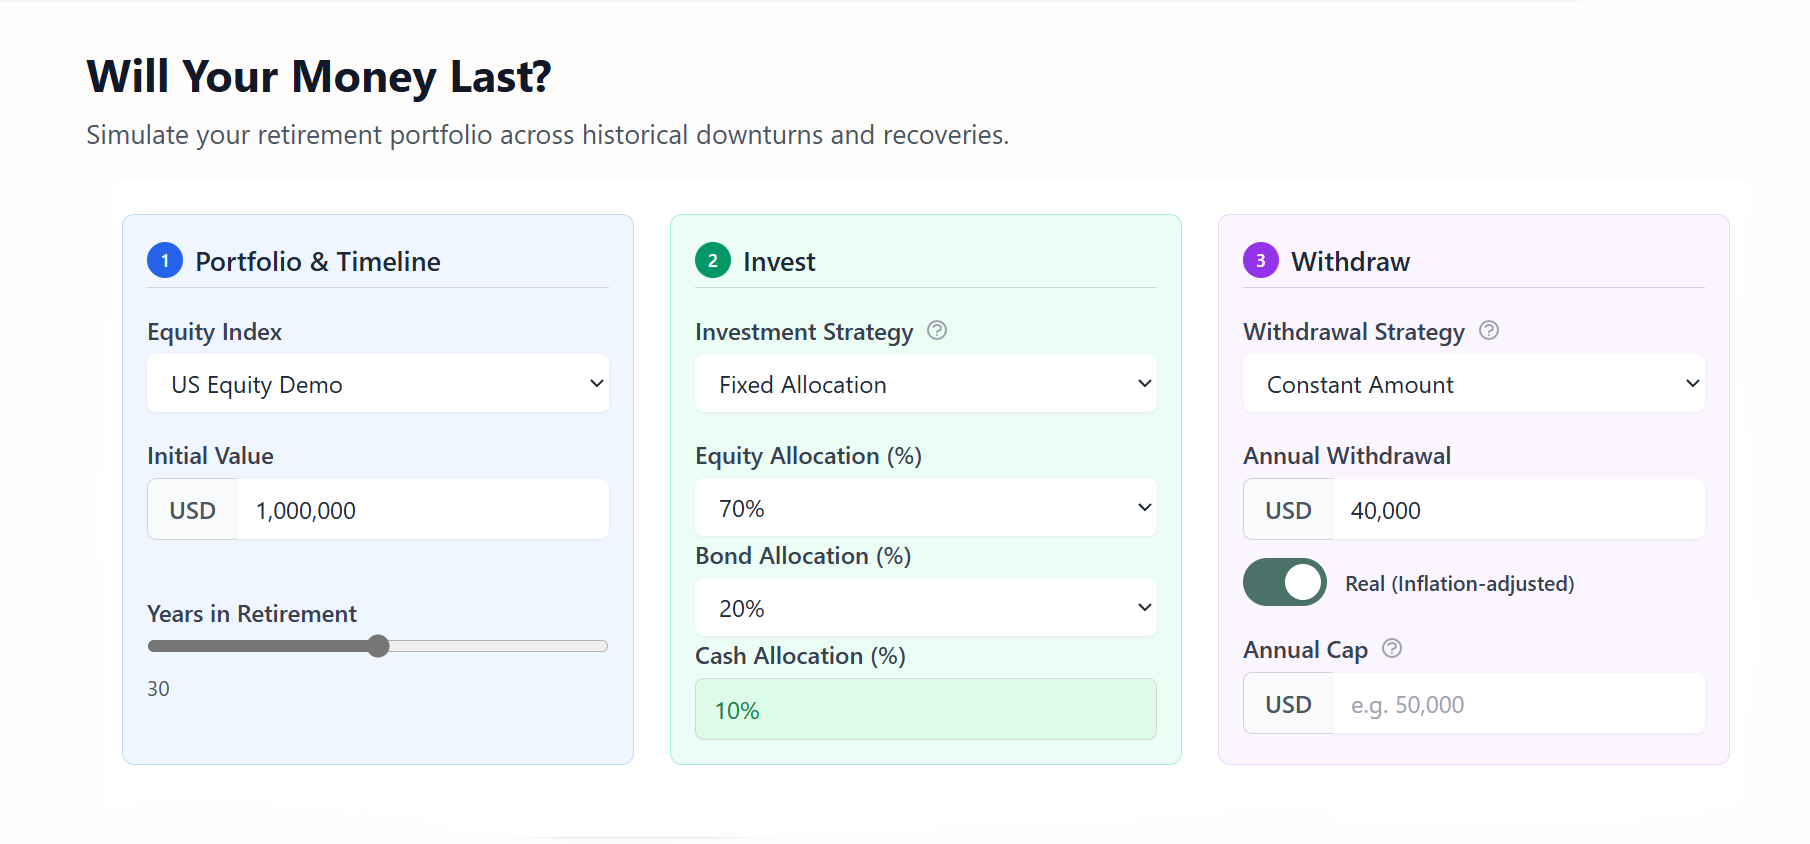
Part 1 — Portfolio & Timeline
The first card on the Bellavia homepage guides you through setting up your basic portfolio parameters.
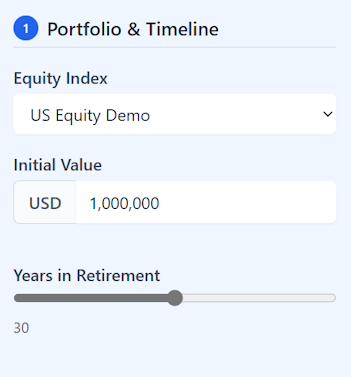
Equity Index Selection
This determines which historical market data your simulation uses. Available options include:
- US Equity Demo — Based on the S&P 500 or broad U.S. market indices
- UK Equity Demo — Based on FTSE or UK market history
- Custom datasets — Upload your own historical data for any market or asset class
The specific index choice depends on where one can invest and what one's home market is. It is much easier to invest in the S&P 500 if one lives in the U.S., for example. It's accessible and provides income in USD. However, by uploading relevant historical data, one can use any market for which data are available.
→ Learn how to upload your own historical data.
Initial Portfolio Value
The initial value of the portfolio is simply the total sum of investable money at our disposal — the initial amount to be split among equity, bonds, and cash.
Investment Horizon
The investment horizon represents the length of time we plan for. Someone retiring at 70 may want to plan for at least 20 years, while someone younger may plan for longer. This affects both portfolio performance and strategy: the longer the expected retirement period, the more conservative the approach should be to ensure the money lasts through the planned duration.
Part 2 — Investment Strategy
This is covered in the second card of the homepage.
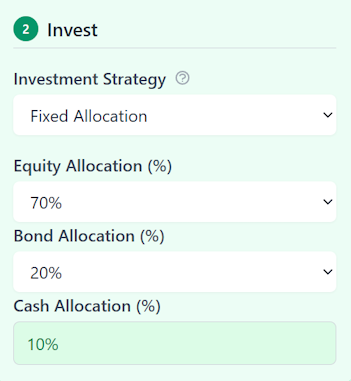
Fixed Allocation
Here we have several choices. The default assumption is a Fixed Allocation — we invest in a specific combination of equity (the Equity Index from Part 1), bonds, and cash.
In general:
- More equity gives more long-term growth but also greater risk.
- Cash has the least risk but also the least growth.
- Bonds sit somewhere in between.
Typical retirement portfolio allocations are 70/30, 60/40, or 60/30/10 in Equity/Bonds/Cash. The exact choice depends on individual risk appetite.
Rebalancing
The idea is that we start with an initial allocation, and as the market moves, this allocation changes — requiring periodic rebalancing.
Simplified Example: If we start with $100K and allocate $60K to stocks and $40K to bonds, and over the next year stock market doubles while bonds stay unchanged, we'd have $120K in stocks and $40K in bonds. This results in a 75/25 split instead of 60/40.
To restore our target 60/40 allocation, we'd sell some equity and buy more bonds. With a new total of $160K, we'd hold $96K in stocks and $64K in bonds.
In Bellavia testing, rebalancing is assumed to be yearly. Once a year, you review performance and rebalance if needed. Bellavia.app includes a Rebalancing Reminder function to assist with this process if you decide to implement it with your actual portfolio.
More advanced allocation strategies, such as glide paths (where equity exposure decreases over time), will be covered in a future post.
Part 3 — Withdrawal Strategy
This is the third card on the homepage.
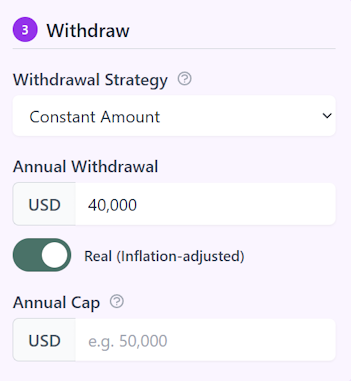
Withdrawal strategy is one of the most discussed aspects of planning: how much you can withdraw and when.
Bellavia provides several withdrawal strategies. All assume one withdrawal per year at the start of the year, though withdrawals could be distributed differently (e.g., monthly) with broadly similar outcomes.
→ Analyze strategy results in depth using Bellavia's Advanced Analytics.
Below is a summary of the main strategies.
1. Fixed Dollar Amount
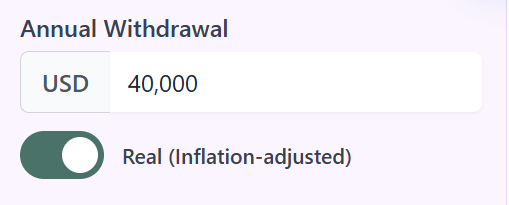
Withdraws the same dollar amount every year regardless of portfolio performance. This is the simplest and most predictable strategy — if you set $40,000 as your annual withdrawal, you'll receive exactly $40,000 each year (or inflation-adjusted if you enable that option).
While this provides maximum spending predictability and makes budgeting easy, it doesn't adapt to market conditions, which means it can deplete your portfolio during prolonged bear markets or leave significant money on the table during bull markets. Best for retirees who need inflexible budgets and value certainty over portfolio preservation.
2. Fixed Percentage
Withdraws a fixed percentage of your current portfolio value each year, meaning your spending adjusts automatically with market performance.
If you choose 4% and your portfolio is worth $1 million, you'll withdraw $40,000 that year — but if your portfolio drops to $800,000 the next year, your withdrawal drops to $32,000.
This strategy ensures your portfolio never fully depletes (since you always withdraw a percentage of what remains), making it ideal for legacy planning and long-term sustainability. However, the variability of annual withdrawals can be difficult to manage.
3. Guardrails (Guyton-Klinger)
The guardrails approach is named after Jonathan Guyton and William Klinger, who published the original framework in the Journal of Financial Planning in 2006. Bellavia offers two implementations of the idea — a flexible parametric version with user-set rate bounds, and the canonical 2006 version that follows Guyton & Klinger's published rules exactly.
Parametric guardrails let you set a target annual withdrawal plus an upper and lower percentage bound — typically 3% and 5% of your portfolio. You take your base withdrawal each year as long as it stays inside the bounds. If a falling portfolio pushes the rate above the upper bound, you cap spending at that bound. If a rising portfolio pulls the rate below the lower bound, you can lift spending. This is the version most calculators mean when they say "guardrails."
Canonical Guyton-Klinger 2006 is the original paper's algorithm in full. Instead of two user-set bounds, it implements four fixed rules that adjust spending in 10% steps:
- Modified Withdrawal Rule (WR) — skips the inflation bump after a negative-return year if doing otherwise would push spending above the initial rate.
- Capital Preservation Rule (CPR) — cuts spending by 10% when the current rate climbs above 120% of the initial rate.
- Prosperity Rule (PR) — raises spending by 10% when the current rate falls below 80% of the initial rate.
- Portfolio Management Rule (PMR) — sources withdrawals in a specific priority order (sell winners first) and rebalances overweight positions to cash.
The canonical version gives up the user-set band widths in exchange for a paper-faithful, fully-specified algorithm with three decades of practitioner literature behind it. Pick parametric if you want explicit control over the worst-case withdrawal rate; pick canonical GK if you want the original algorithm without choosing the thresholds yourself.
Parametric example: With a $40,000 base and 3–5% guardrails on a $1 million portfolio, you'd withdraw $40,000 initially. If the portfolio dropped to $700,000, that $40,000 would represent 5.7%, triggering a reduction to $35,000.
Canonical GK example: Starting at a 4% initial rate ($40,000 on $1 million), the CPR triggers a cut whenever the current rate exceeds 4.8% (120% of 4%). After a portfolio fall to $750,000, $40,000 represents 5.3%, triggering a 10% cut to $36,000. The next year's behavior depends on the WR (whether to skip inflation) and whether portfolio recovery brings the rate back inside the band.
Both implementations historically achieve higher success rates than fixed dollar withdrawals while requiring less lifestyle volatility than fixed percentages. They differ on how they adapt — parametric resets each year, canonical GK builds memory through cumulative 10% steps — but both deliver similar welfare outcomes on average.
→ To try canonical GK, open the Bellavia calculator and select "GK Guardrails (Original 2006)" from the withdrawal-strategy dropdown (premium feature). For the deep dive on how the four rules interact and how the two implementations compare cohort-by-cohort, see GK Guardrails Explained.
4. The 95% Rule
Withdraws the greater of your target percentage or 95% of last year's withdrawal, providing a spending floor that prevents sudden drops.
If you target 4% withdrawals and your portfolio drops from $1 million to $800,000, instead of cutting from $40,000 to $32,000, you'd reduce to $38,000 (95% of the prior year).
This smooths spending changes while allowing participation in market growth. It's well-suited for retirees who want moderate downside protection but can tolerate gradual adjustments.
5. 1/N (Remaining Years)
Divides your current portfolio value by the number of years remaining in your retirement, ensuring you spend your last dollar in your final year.
For example, with a 30-year retirement and $1 million starting portfolio, you'd withdraw $1,000,000 ÷ 29 = $34,483 in year one, then recalculate each year.
Spending accelerates toward the end of retirement and lacks inflation protection, making it mostly theoretical but valuable for understanding withdrawal mechanics.
More Strategies Coming: Additional withdrawal strategies are being developed and tested in Bellavia and will be added in future releases.
Part 4 — Real Versus Nominal
When discussing portfolio performance and backtesting, it's crucial to distinguish between real and nominal values.
Given that inflation is almost always positive, the same nominal amount (e.g., $1,000) will buy less in the future than it does today.
Bellavia adjusts for inflation using the CPI, ensuring you analyze results in real (inflation-adjusted) terms if desired.
When you specify an income goal, be clear whether it's nominal (the same number of dollars each year) or real (the same purchasing power as today's dollars). This choice is controlled by the real/nominal toggle.
Part 5 — Extra Cashflows
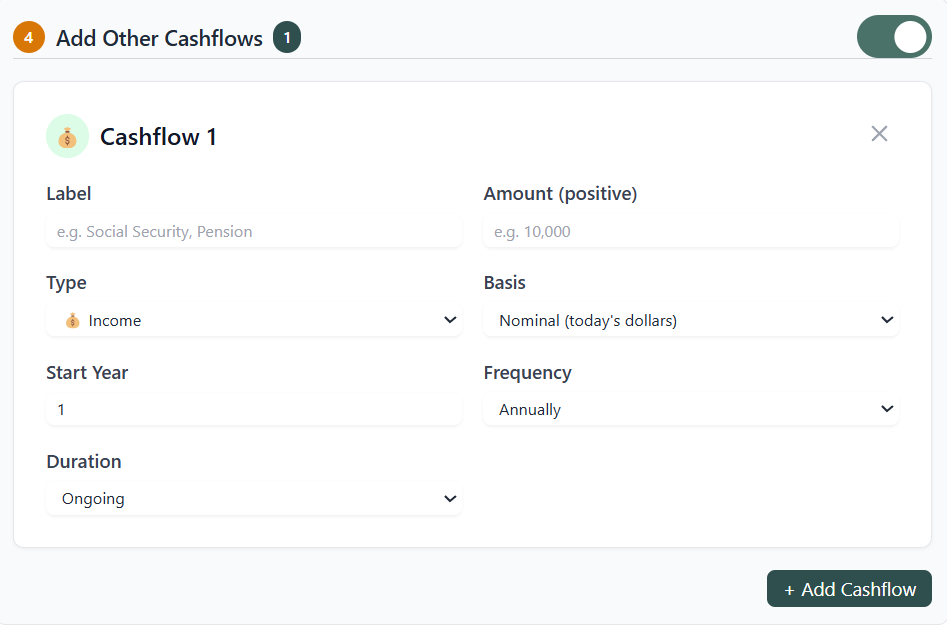
Finally, we recognize that retirement income often includes external cashflows — both positive and negative. You can enter these in the Extra Cashflows section.
How Cashflows Work
Extra cashflows directly modify your portfolio's net withdrawal each year, affecting how much money is actually removed from or added to your investments.
Bellavia uses a sign convention where income is negative (reducing withdrawals) and expenses are positive (increasing withdrawals). Think of it as "net money flowing out of the portfolio."
Example:
- If you add Social Security income of $30,000 and your base withdrawal strategy calls for $50,000, your net withdrawal is $20,000.
- Conversely, if you add a one-time $50,000 home renovation expense, your net withdrawal becomes $100,000 even though your base strategy is $50,000.
Impact on Portfolio Performance
The net amount is proportionally removed from your asset allocation (e.g., 60% from stocks, 40% from bonds). After that, the portfolio rebalances and market returns are applied.
Income allows your portfolio to grow faster through compounding, while expenses accelerate depletion not just through direct withdrawal but also by eliminating potential future growth.
Timing matters enormously: Early income (like part-time work in years 1–5) compounds over decades and can dramatically improve success rates. Late expenses (like long-term care costs in year 25) have less time to compound but can still tip a marginal portfolio into failure if reserves are already low.
Part 6 — Tax Considerations (Not Included)
Each source of income can have different tax treatment.
Tax analysis is not currently part of Bellavia's historical backtesting, for two reasons:
- Every individual's tax situation is unique, and Bellavia provides analysis and education — not tax advice.
- Each historical period simulated by Bellavia would have had a different tax regime, and future conditions will differ again.
You are therefore encouraged to consult a tax professional or financial advisor regarding these issues.
Continue reading
- The 4% Rule Is Wrong: What the Creator Now Recommends
- Maximum Withdrawal Rate: 4%, 5%, or 6%? 150 Years of Evidence
- GK Guardrails Explained: How the 2006 Decision Rules Actually Work
- Sequence of Returns Risk Calculator: Early Years Matter Most
- Sequence of Returns Risk: Why Retirement Timing Can Make or Break Your $1M Portfolio
- Historical 90% and Monte Carlo 90% Are Not the Same Number
- How Long Will $1M Last? We Tested Every Year Since 1871
- 4% Rule UK: Why British Retirees Need a Different Strategy
Discussion (0)
Join the conversation
Log in to commentNo comments yet. Be the first to share your thoughts!