The Problem: Your Retirement Plan Is Based on Incomplete Data
If you're like most people planning for retirement, you've heard the 4% rule: withdraw 4% of your portfolio in year one, adjust for inflation each year after, and your money should last 30 years.
It's simple. It's memorable. And it's everywhere—from financial advisors to retirement calculators to personal finance blogs.
There's just one problem: even the guy who created it doesn't think it's accurate.
What Is the 4% Rule? (And Why Everyone Uses It)
The 4% rule was introduced by financial planner William Bengen in 1994. He analyzed historical U.S. stock and bond returns to find the withdrawal rate that would have survived the worst market conditions in modern history—including the Great Depression of the 1930s and the stagflation crisis of the 1970s.
Year 1: Withdraw 4% of your total portfolio value
Year 2+: Take the same dollar amount as Year 1, adjusted for inflation
Goal: Make your money last at least 30 years
Example: With a $500,000 portfolio, you'd withdraw $20,000 in year one. If inflation is 3%, you'd withdraw $20,600 in year two, $21,218 in year three, and so on—regardless of how your portfolio performs.
The rule gained widespread recognition through the 1998 Trinity Study, a landmark paper by three finance professors that validated Bengen's approach using similar data.
Plot Twist #1: Bengen Now Recommends 4.7% Instead
Here's where it gets interesting.
After analyzing additional decades of market data and refining his models, William Bengen himself revised his recommendation to 4.7%—a 17.5% increase in retirement income.
What this means in real dollars:
| Portfolio Value | 4% Rule (Year 1) | 4.7% Updated | Annual Difference |
|---|---|---|---|
| $500,000 | $20,000 | $23,500 | +$3,500 |
| $750,000 | $30,000 | $35,250 | +$5,250 |
| $1,000,000 | $40,000 | $47,000 | +$7,000 |
That's potentially $200,000+ more spending over a 30-year retirement—or the difference between a comfortable retirement and one where you're constantly worried about running out.
The $200,000 Question: See what the difference between 4% and 4.7% means for your portfolio
Plot Twist #2: Research on Global Data Suggests It Might Be Much Lower!
But wait—there's more.
While Bengen revised his number upward, other researchers went in a different direction. And their reasoning is at least as valid.
The U.S. Market Exceptionalism Problem
Both Bengen's original study and the Trinity Study used U.S. market data from 1926 onward. The problem? The 20th century American market was one of the most exceptional success stories in financial history.
When researchers analyzed 39 developed countries from 1890 to 2023, they found something uncomfortable: Many developed markets experienced catastrophic losses that never fully recovered. U.S. returns were unusually high compared to the global average.
Using this comprehensive global dataset and modern probabilistic methods, researchers estimated that a truly safe withdrawal rate might be closer to 2.26% for a couple aged 65 targeting only a 5% chance of running out of money.
That's nearly half of the original 4% rule.
Why This Matters for Your Retirement
You're essentially making a bet: that the next 30 years of markets will look more like America's golden century than like the average developed country's experience—which included:
- The 1923 German hyperinflation (wealth essentially disappeared)
- Japan's 1990s "Lost Decade" (the Nikkei has recently recovered to 1989 levels)
- Multiple European markets that took 40+ years to recover from WWII
The question here isn't how well America will keep doing. It's whether you want to plan for the best-case scenario or prepare for a more realistic range of outcomes.
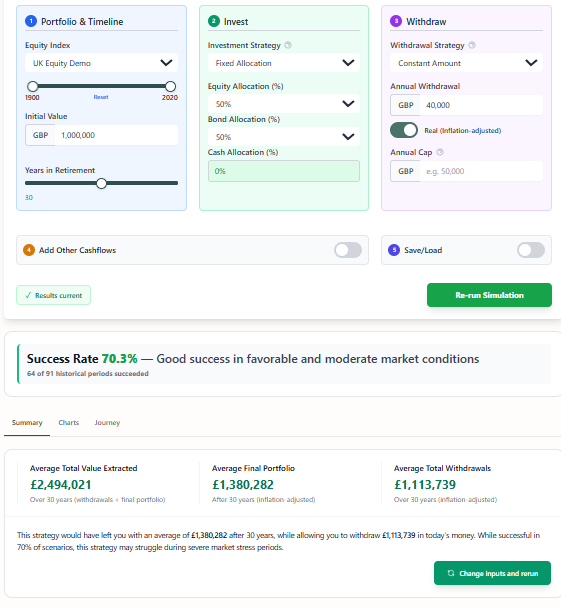
Test it yourself: Upload global market data and compare U.S. vs. international scenarios
The Hidden Risk: Sequence of Returns
Even if the average returns work out, there's another problem: timing.
Imagine two retirees with identical portfolios:
- Retiree A retires just before a bull market (like 1982)
- Retiree B retires just before a crash (like 2000 or 2008)
Even if both experience the same average returns over 30 years, Retiree B's portfolio is far more likely to run dry because they're selling stocks at depressed prices early in retirement to fund their lifestyle. As a result, they restrict their future portfolio size.
This is called sequence of returns risk, and it's why the 4% rule—which never adjusts based on market conditions—can be dangerous. You're withdrawing the same inflation-adjusted amount whether your portfolio is up 25% or down 35%.
The Alternative: Dynamic Withdrawal Strategies
The constant-dollar approach (4% rule) has a fundamental flaw: it ignores market reality.
Modern retirement research increasingly favors dynamic strategies that adjust withdrawals based on:
- Current portfolio value
- Market performance
- Life expectancy updates
- Economic conditions
These strategies generally show higher Withdrawal Rate Efficiency (WRE)—meaning you can safely withdraw more over your lifetime while actually reducing the risk of running out.
Examples of dynamic approaches:
- Guardrails strategy: Adjust spending when portfolio value hits predetermined thresholds
- Mortality-updating strategy: Recalculate safe withdrawal rate as you age
- Required Minimum Distribution (RMD) method: Use the same percentage formula the IRS requires for traditional IRAs
The math is more complex, but the benefit is real: most retirees can sustainably withdraw more than 4% if they're willing to be flexible.
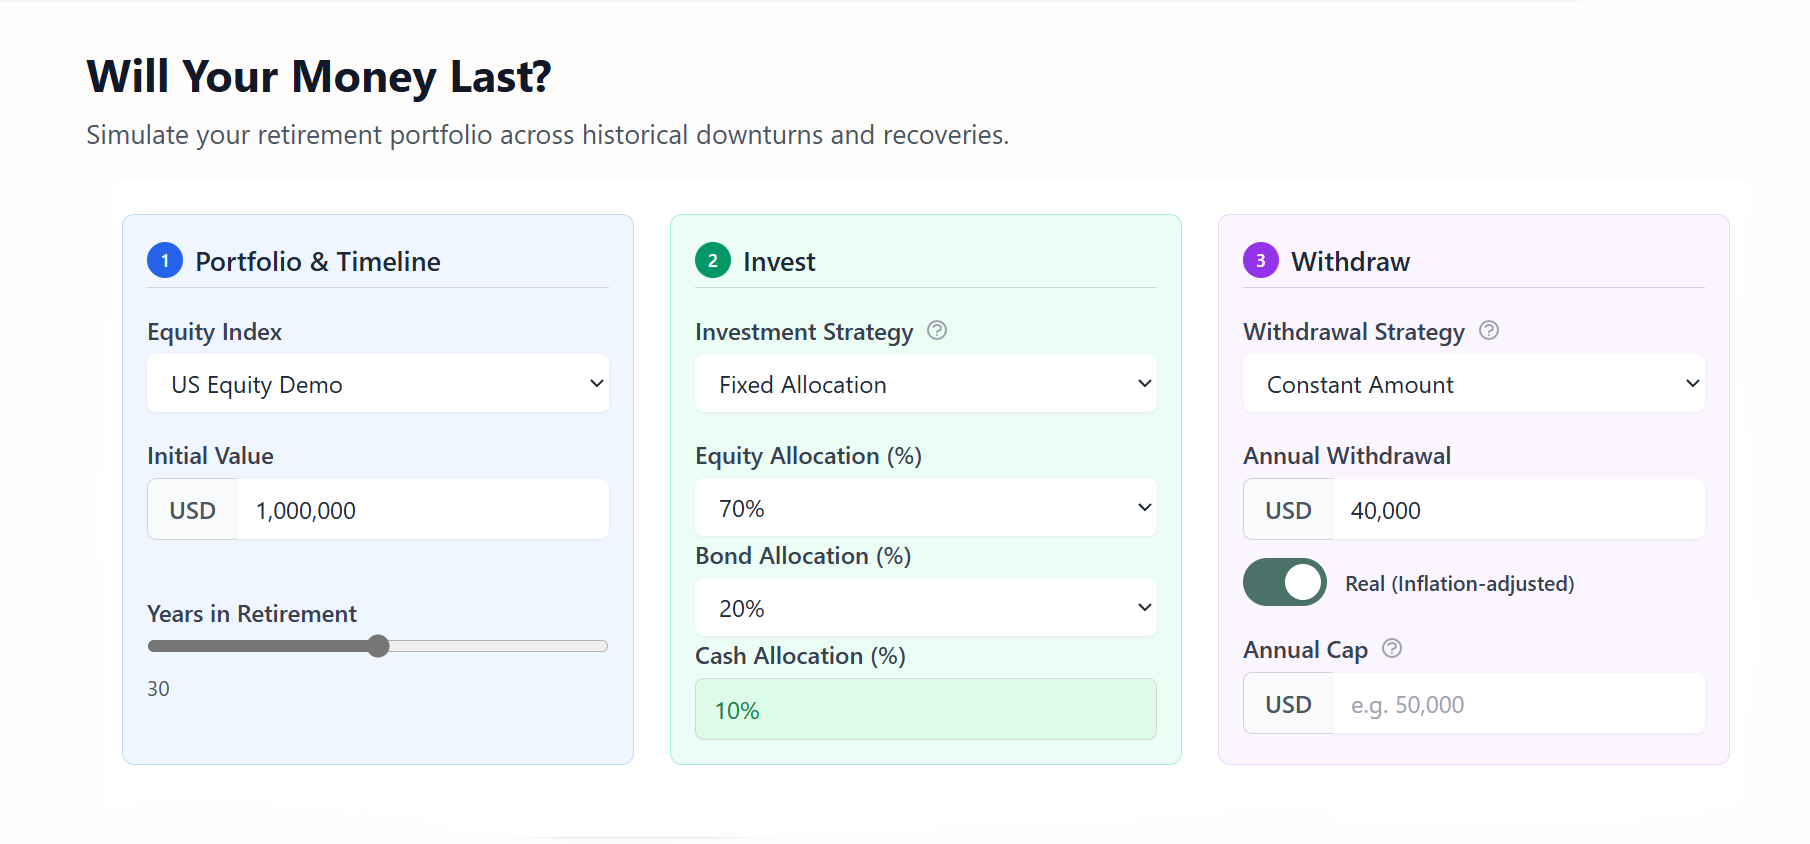
Why Most Retirement Calculators Can't Test What Really Matters
Here's something most people don't realize: the calculator you're using is probably locked into generic assumptions.
Most retirement tools:
- Force you to use pre-loaded U.S. historical data only
- Run Monte Carlo simulations assuming normal return distributions
- Don't let you test alternative historical scenarios
- Can't model your specific concerns about future market conditions
- Portfolio performance during the 1970s stagflation period specifically?
- How your plan would fare using Japanese market data from 1990-2020?
- Custom stress scenarios based on emerging market crises?
- Historical data that extends before 1926?
Bellavia Takes a Different Approach
Instead of forcing you into a one-size-fits-all model, Bellavia lets you bring your own data and adjust the testing periods.
Want to stress-test against:
- Global market data covering 39 countries from 1890-2023?
- Specific historical periods like the Great Depression or 1970s inflation?
- Custom asset classes beyond standard U.S. stocks and bonds?
- Your own market assumptions about future returns?
You can upload it. Format your historical returns, inflation rates, and correlations—and Bellavia will run your portfolio through those specific scenarios. Within each historical time series you will also be able to select the period you want to test against.
Because the most important question isn't "what did the average U.S. retiree experience?" It's "how would my specific portfolio perform under the conditions I'm most concerned about?"
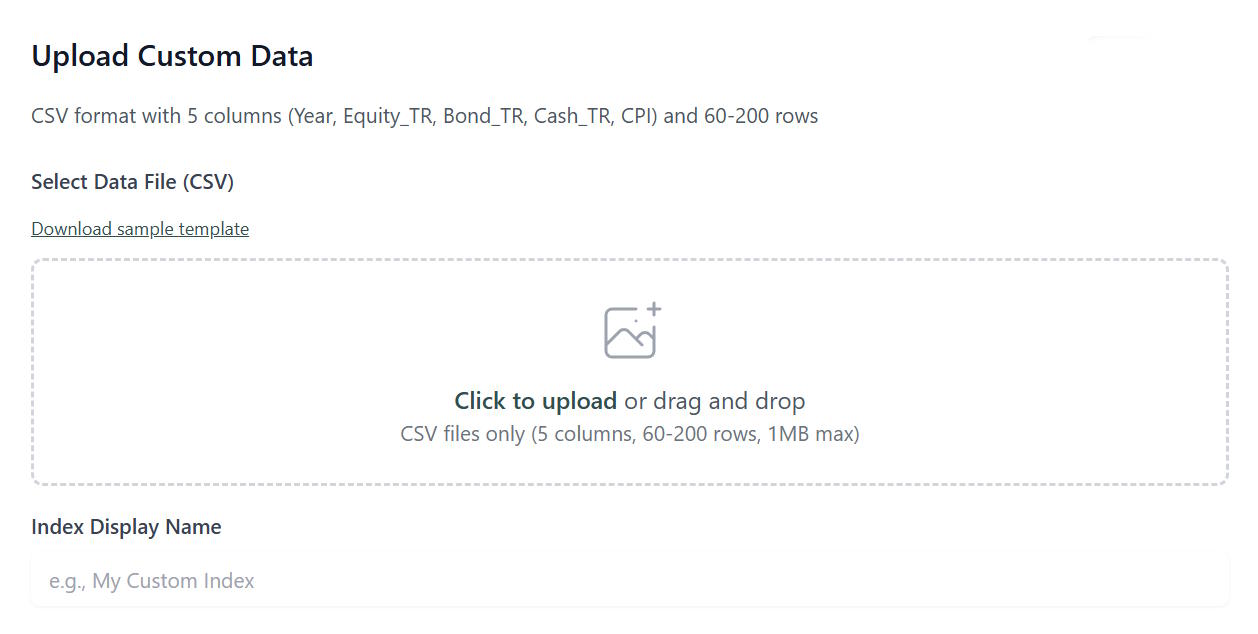
Upload custom data: Test your portfolio against any historical period or market scenario
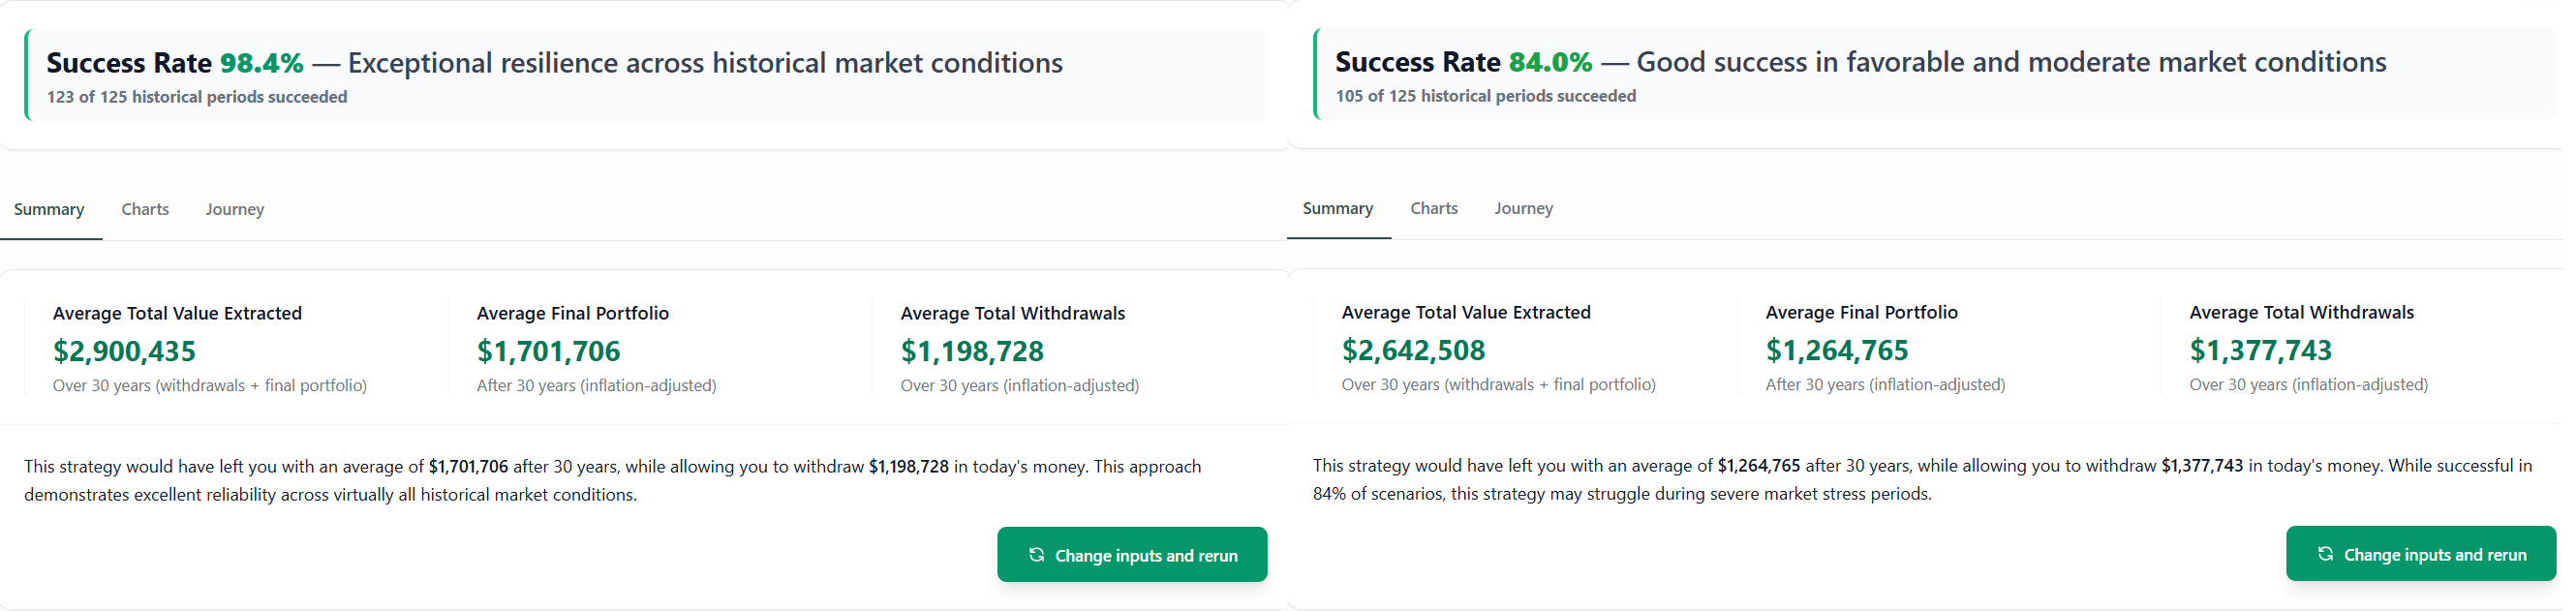
What the Research Actually Says
The academic debate isn't settled, but here's the consensus:
✓ The 4% rule worked for U.S. retirees historically — Based on 1926-2020 data, most 4% withdrawal plans survived 30 years with a 60/40 stock/bond portfolio.
⚠️ It may not work going forward — Lower expected returns, longer lifespans, and higher valuations today make the historical record less reliable.
✗ One-size-fits-all is dead — Your safe withdrawal rate depends on your age, portfolio allocation, flexibility, legacy goals, and risk tolerance.
✓ Dynamic beats static — Research consistently shows that flexible withdrawal strategies outperform fixed approaches.
✓ Testing multiple scenarios matters — The most robust retirement plans aren't built on a single historical dataset—they're stress-tested against multiple possible futures.
So What Could You Do?
The 4% rule isn't "wrong" exactly—it's incomplete. Here's a practical framework:
1. Start with 4% as a baseline, not a guarantee
Use it as a reference point, but understand it comes with significant uncertainty.
2. Stress-test against realistic scenarios
Don't just ask "what if I get 7% average returns?" Ask:
- What if I retire into a market crash?
- What if returns are mediocre for the first decade?
- What if conditions resemble Japan's lost decades rather than U.S. growth?
- What if I live to 100?
3. Test with data that reflects your concerns
If you're worried about a specific scenario—say, extended low returns or high inflation—don't rely on generic assumptions. You can focus on such periods by adjusting the slider on the Bellavia calculator:
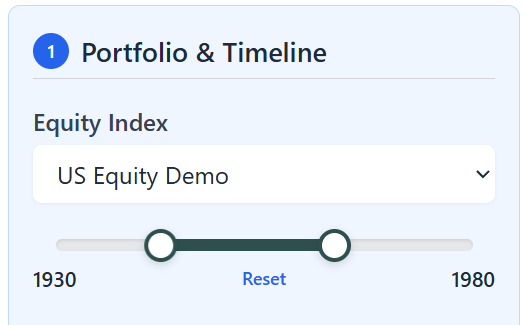
Adjust data ranges: Select any historical period from your data set.
Also, you can load new historical data from periods when different market conditions actually occurred and see how your portfolio would have performed.
4. Build in flexibility
The retirees who succeed are the ones who can adjust. Consider:
- Variable spending (spend more in good years, less in bad)
- Part-time work for the first few retirement years (you can use the extra cashflows option to adjust for extra income or expenses)
- Flexible discretionary expenses you can cut if needed
5. Use tools that match your sophistication
The retirement planning landscape has evolved dramatically since 1994. If you're the type of person who reads academic research and wants to test custom scenarios, you need tools that don't lock you into generic assumptions.
The Data Behind the Debate
The 4% rule debate isn't just opinion—it's grounded in decades of rigorous academic research:
Original Foundation:
- Bengen (1994): "Determining Withdrawal Rates Using Historical Data" - Journal of Financial Planning
- Trinity Study (1998): "Retirement Savings: Choosing a Withdrawal Rate That Is Sustainable" - Cooley, Hubbard & Walz
Key Critiques:
- Pfau (2010): "An International Perspective on Safe Withdrawal Rates: The Demise of the 4 Percent Rule?" - Journal of Financial Planning
- Finke, Pfau & Blanchett (2013): "The 4 Percent Rule Is Not Safe in a Low-Yield World" - Journal of Financial Planning
- Anarkulova, Cederburg & O'Doherty (2022): "Stocks for the long run? Evidence from a broad sample of developed markets" - Journal of Financial Economics
Data Sources Used in Modern Research:
Leading studies now draw on:
- Global Financial Database (GFD): Total return indexes for stocks, bonds, and bills across 39 countries
- JST Macrohistory Database: Long-term financial data validated against League of Nations archives and Federal Reserve sources
- Nonparametric bootstrap methods: Preserving actual historical correlations rather than assuming normal distributions
This represents a quantum leap beyond the 1926-1990s U.S. data that informed the original rule.
Want to test your retirement plan using these same datasets? Bellavia accepts custom data uploads in standard formats, allowing you to stress-test your portfolio against the same comprehensive historical scenarios that academic researchers use.
The Bottom Line
The 4% rule was a breakthrough when Bengen introduced it in 1994—giving retirees a simple, memorable guideline backed by historical data.
But three decades later, we know more:
- The creator updated it to 4.7% (based on extended U.S. data)
- Global data suggests it might be lower (accounting for non-U.S. market realities)
- Dynamic strategies are more efficient (flexibility beats rigidity)
- Your situation is unique (one-size-fits-all never really fit all)
- The scenarios you test matter (generic assumptions produce generic answers)
The real lessons?
Use the 4% rule as a starting point, then stress-test it against scenarios that reflect your actual concerns—whether that's U.S. data, global data, specific historical periods, or custom assumptions about the future. Build in flexibility. Plan for uncertainty.
Your financial well-being is too important to base on a heuristic, even a good one. And it's definitely too important to trust a calculator that won't let you test all the scenarios you care about.
Frequently Asked Questions
Is the 4% rule still valid in 2024?
It depends on your definition of "valid." Historically, 4% worked for U.S. retirees with 30-year horizons. But current market valuations, global data, and lower expected returns suggest it may be optimistic going forward. Bengen himself revised it upwards while global studies suggest it could be lower. The safest approach: stress-test your specific situation rather than relying on any single rule.
What is better than the 4% rule?
Dynamic withdrawal strategies that adjust based on portfolio performance and life expectancy typically outperform fixed strategies. Examples include guardrails approaches, mortality-updating methods, and RMD-based strategies. These require more active management but generally allow higher lifetime withdrawals with lower failure risk.
How much money do I need to retire using the 4% rule?
Multiply your desired annual retirement income by 25. Want $40,000/year? You'd need $1 million ($40,000 = 4% of $1,000,000). Want $60,000/year? You'd need $1.5 million. But remember: this is a starting point, not a guarantee. Your actual safe withdrawal rate depends on your specific circumstances.
What happens if I withdraw more than 4%?
Your portfolio has a higher probability of being depleted before 30 years. However, "probability" isn't "certainty". If you retire into strong markets and are willing to cut spending during downturns, you might safely withdraw more. Conversely, retiring into a crash with a rigid 4% plan can still fail. Context matters more than the percentage.
Should I use U.S. data or global data for planning?
Both have value. U.S. data reflects the specific market you likely invest in; global data provides a more conservative, comprehensive view of what's possible. The most robust approach: test your plan against both U.S. worst-case scenarios AND global market crises to understand your true risk exposure. Bellavia lets you upload and test with either dataset.
Can I really test my retirement plan with the same data researchers use?
Yes. Some academic datasets (like the JST Macrohistory Database and Shiller Data) are publicly available. Bellavia accepts custom data uploads, so you can format these datasets and run your portfolio through the same historical scenarios that inform current academic research. This gives you institutional-grade analysis without institutional-grade fees.
Ready to Move Beyond Rules of Thumb?
Bellavia gives you the flexibility to test your retirement strategy against any historical scenario that concerns you from U.S. boom periods to global market crises spanning 100+ years.
Start your free analysis →14-day free trial available
About the Research
This article draws on peer-reviewed research from leading journals in finance and retirement planning. For a complete bibliography of academic sources, including the original Bengen papers, Trinity Study, and recent global market analyses.
The global market data referenced in recent studies comes from sources like the JST Macrohistory Database covering 20+ developed countries from 1871-2020 and GFdatabase. Some of these datasets are publicly available and can be uploaded to Bellavia for custom retirement plan stress-testing.
Discussion (0)
Join the conversation
Log in to commentNo comments yet. Be the first to share your thoughts!