Prerequisites: You'll need a Bellavia Premium account to upload custom datasets. If you don't have one yet, you can upgrade from your Settings page.
Step 1: Access the Macrohistory Database
Go to the Macrohistory Database website.
Click on the EXCEL button to download the latest release: JSTdatasetR6.xlsx
The full explanation of the data can be found in the official documentation at JST_documentationR6.pdf
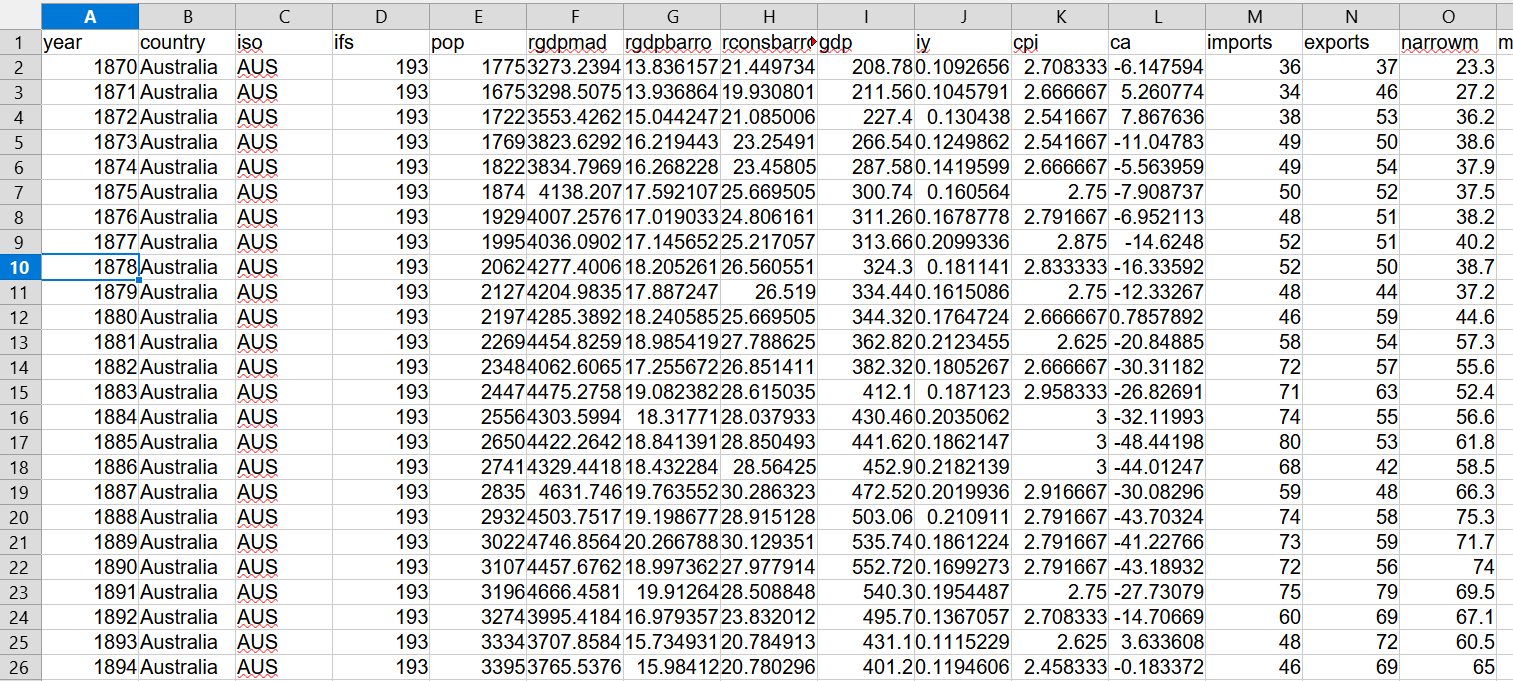
Screenshot of the Macrohistory Database download page
Step 2: Understand the Dataset Structure
There are data for many countries here from 1870 to 2020. Notice that:
- The data in this dataset are yearly
- We only need a few of the available columns
- Not all data sets are complete
- The data of interest are in nominal terms
Suppose we want to focus on the UK data. We can do Data > Autofilter and then filter by country. The result is as follows:
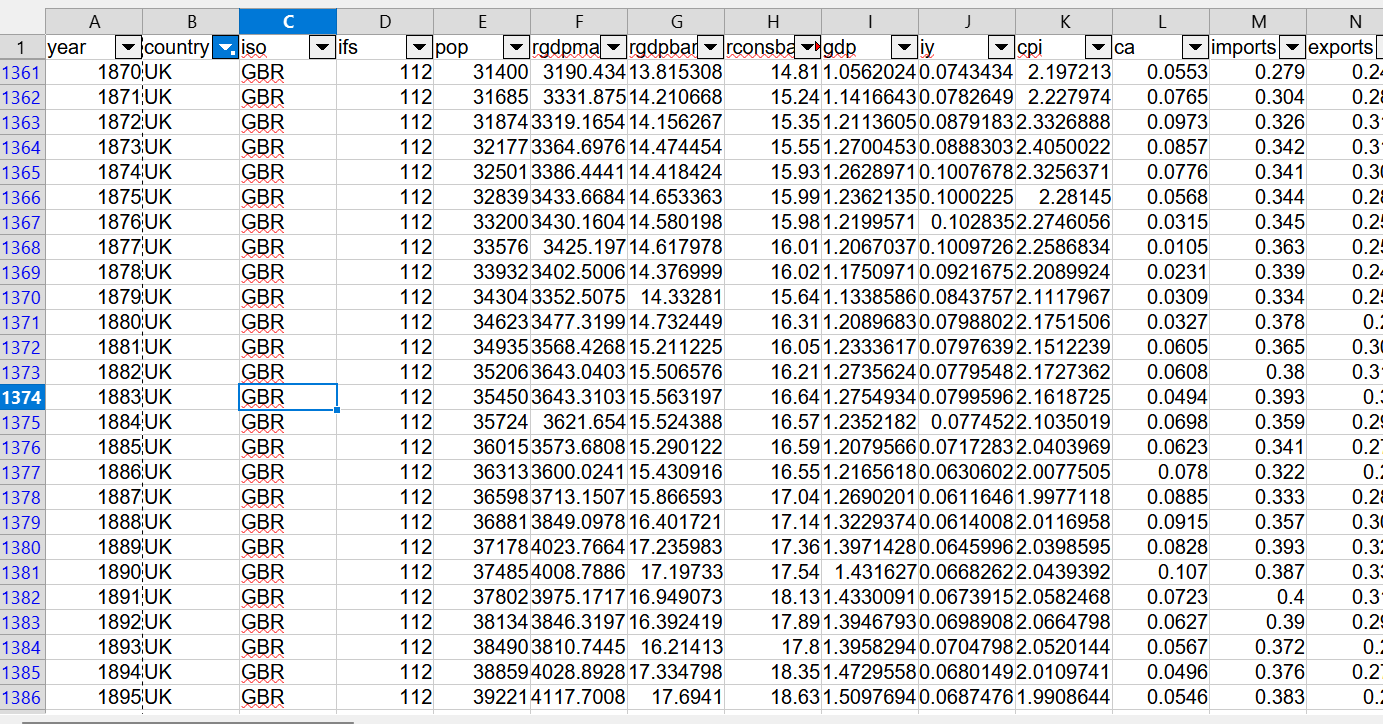
Filtered UK data in Excel showing the country selection
Step 3: Select the Required Columns
From this dataset we need the following columns:
- Column A → Year
- Column K → CPI (Consumer Price Index)
- Column AO → eq_tr (Equity total return, nominal. r[t] = [[p[t] + d[t]] / p[t-1] ] - 1)
- Column AQ → bond_tr (Government bond total return, nominal. r[t] = [[p[t] + coupon[t]] / p[t-1] ] - 1)
- Column Q → stir (Short-term interest rate (nominal, percent per year))
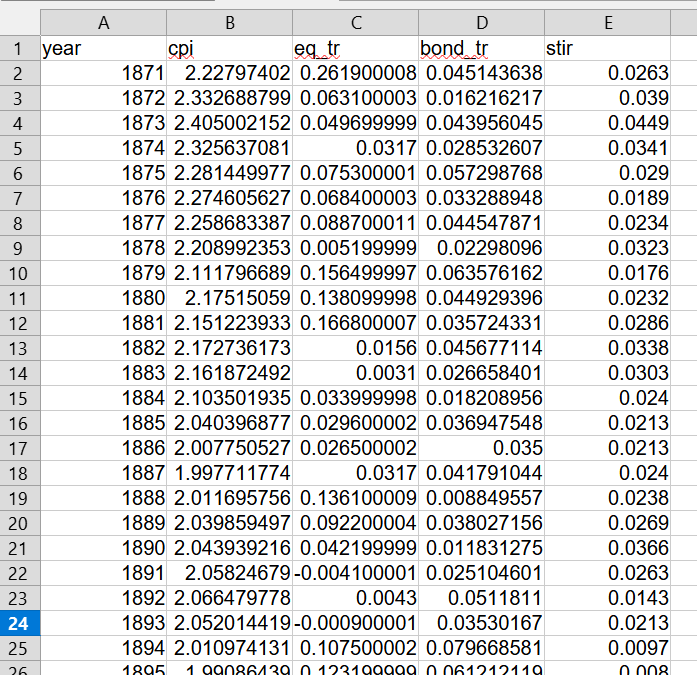
We can copy these columns to a new workbook as values:
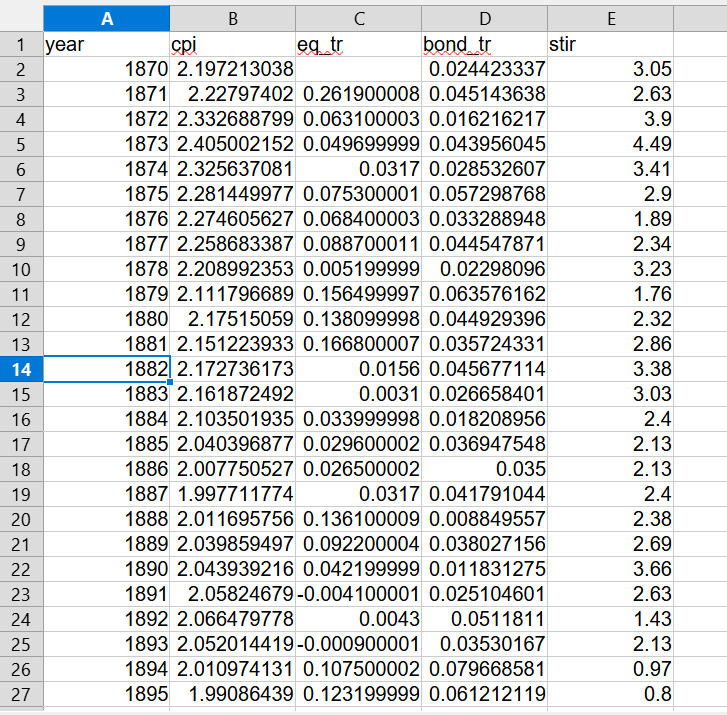
Selected columns copied to a new workbook
Step 4: Clean the Data
We see that there is a data point missing for 1870, so we can choose to delete the year 1870 from our data.
Also, the stir column is in nominal percent per year and we have to divide by 100 to express it consistently with the other numbers.
The stir column divided by 100 to convert to decimal format
Step 5: Convert to Cumulative Total Returns
Then we observe that these data are yearly total return and what we need is the cumulative total return. So we can simply assume 100 as the base value for eq_tr, bond_tr and stir and then use the existing yearly return to calculate numbers in a new format:
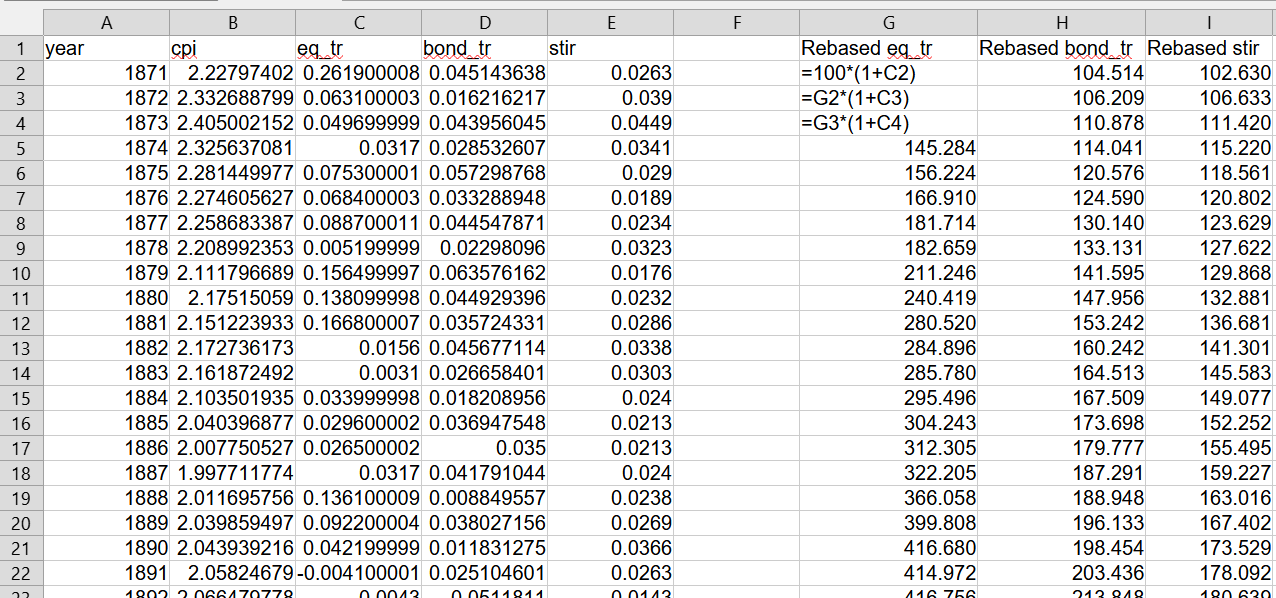
Cumulative return calculations based on yearly returns
Step 6: Format Column Names for Bellavia
Then these numbers we can copy as values to the old positions and rename them with the column names required for the Bellavia App, that is:
YearEquity_TRBond_TRCash_TRCPI
The final workbook will look as follows (column order is not important):
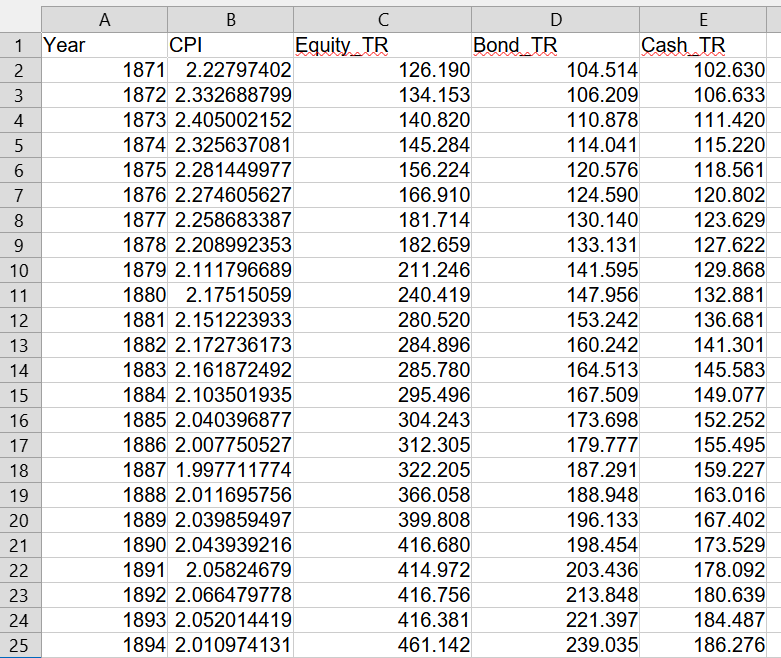
Final formatted data with correct column names for Bellavia
Step 7: Save as CSV
We can then save this spreadsheet as a CSV file and upload it from the Settings page of Bellavia.app
- It is important to note that the data here are in Nominal terms so the box "My data is in real (inflation-adjusted) terms" should be left unticked!
- And the currency in this case should be set to GBP (British Pound Sterling).
Step 8: Upload to Bellavia
Once you have your CSV file ready, follow these steps to upload it to Bellavia:
- Log in to your Bellavia account
- Navigate to Settings in the top menu
- Scroll to the Data Management section
- Click on Upload Custom Data
- Choose your CSV file
- Enter a display name (e.g., "UK JST Data 1871-2020")
- Select GBP - British Pound (£) as the currency
- Leave unticked: My data is in real (inflation-adjusted) terms
- (Optional) Add a description like "Jordà-Schularick-Taylor UK historical data 1871-2020"
- Click Upload Data
Bellavia will validate your data before uploading. If there are any format issues, you'll see specific error messages.
Step 9: Use Your Custom Dataset
Once uploaded, your JST dataset is ready to use:
- Go to the Bellavia Home page (main simulator)
- In the Portfolio & Timeline section, click the Equity Index dropdown
- Your custom "UK JST Data" dataset will appear in the list
- Select it and run your simulation
You can now test retirement scenarios across 150+ years of real UK market history, including all major financial crises, wars, and market conditions.
Data Format Requirements
If you encounter upload errors, verify your CSV meets these requirements:
- CSV format with comma separators
- Exactly 5 columns: Year, Equity_TR, Bond_TR, Cash_TR, CPI
- Between 60-200 data rows (more than 60 years of data)
- Year format: YYYY (e.g., 2024)
- Numeric values should be clean (no commas or special characters)
- Missing values will be automatically removed
Available Countries in JST Dataset
The JST Macrohistory Database includes data for the following countries, which you can process using the same method:
- Australia
- Belgium
- Canada
- Denmark
- Finland
- France
- Germany
- Italy
- Japan
- Netherlands
- Norway
- Portugal
- Spain
- Sweden
- Switzerland
- United Kingdom
- United States
Conclusion
With the JST Macrohistory Database uploaded, you've significantly enhanced Bellavia's analytical power. You can now run simulations across 150+ years of international market history, stress-test your retirement plan against every major economic crisis, and gain confidence that your strategy works in both bull and bear markets across different countries.
Ready to run your first simulation with the JST data? Head to the Home page and select your newly uploaded dataset from the equity index dropdown.
Frequently Asked Questions
How long does it take to process JST data for Bellavia?
The entire process takes approximately 20-30 minutes, including downloading from the JST website, filtering and formatting in Excel, and uploading to Bellavia.
Do I need a Premium account to upload custom datasets?
Yes, custom dataset uploads are a Premium feature. You can start a 14-day free trial to test this functionality.
What if my data is in real terms instead of nominal?
If your data is inflation-adjusted (real terms), simply tick the "My data is in real (inflation-adjusted) terms" checkbox during upload. Bellavia will handle the data accordingly.
Can I upload data for multiple countries?
Yes! You can upload multiple datasets, one for each country. Each dataset will appear separately in the Equity Index dropdown, allowing you to compare retirement scenarios across different countries.
Ready to Explore International Market History?
You've just unlocked access to 150+ years of market data across 17 countries. Now test your retirement plan against diverse economic conditions from around the world.
Start Your Simulation →14-day free trial available
Discussion (0)
Join the conversation
Log in to commentNo comments yet. Be the first to share your thoughts!