
Following the previous posts on timing, the 3% rule and its UK variance, I want to continue the series about saving portfolios and "safe" savings rates. In this post, I will focus on the annuity formula and highlight the differences between Bellavia Savings Calculator and the simple formula that is so often used to calculate saving projections.
The Formula
The future value of an annuity is the bedrock of every savings projection:
$$FV = PMT \times \frac{(1+r)^n - 1}{r}$$
Where
-
$PMT$ = yearly regular contribution
-
$r$ = expected return (annual)
-
$n$ = years
-
$FV$ = what you end up with
Quick example: We often hear about a $7\%$ long-term equity return. If you save $\$1000$/month, that is $\$12000$/year, at $7\%$ for $30$ years you end up with:
$$FV = \$12,000 \times \frac{(1.07)^{30} - 1}{0.07} = \$1,133,530$$
Plug in your numbers, get your answer.
It is important to get the rate right in this formula. The same calculation with $9\%$ rate would yield $\$1,635,691$, a much larger number!
The Hidden Assumptions
There are several hidden assumptions here. Let's go over them.
First, the rate of return depends on where the money is invested. Is it in a savings account? In the markets? Often, long-term savings are invested in a combination of equities and bonds. Which $r$ do you use?
Second, for the result to be correct, $r$ should be the real rate of return. This means that if the asset returns $9\%$ and inflation is $3\%$, then the $r$ that should be used is $6\%$. But how do you know future returns and future inflation?
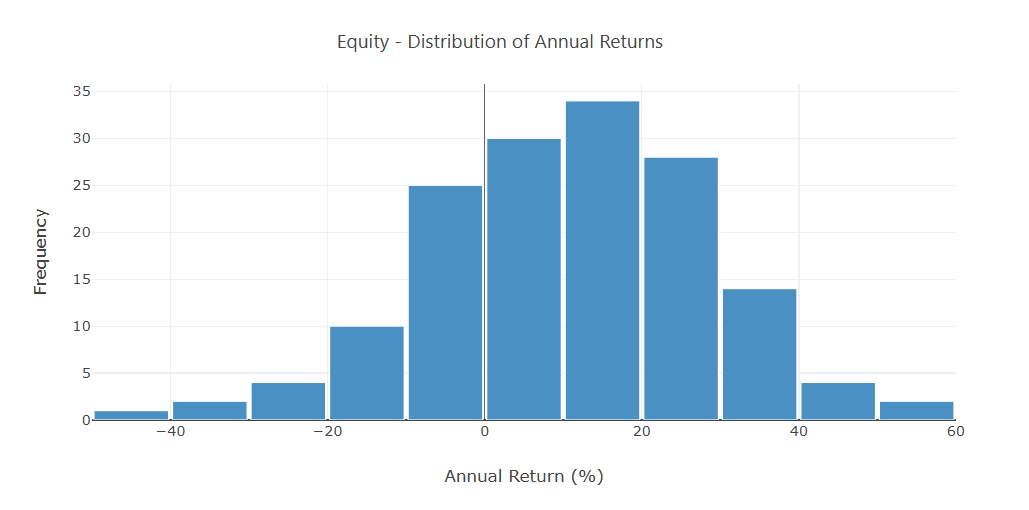
Third, $r$ should be constant. Markets don't work that way. We see in the figures below the actual S&P 500 return distributions:
The inflation rates for the same period look like this:
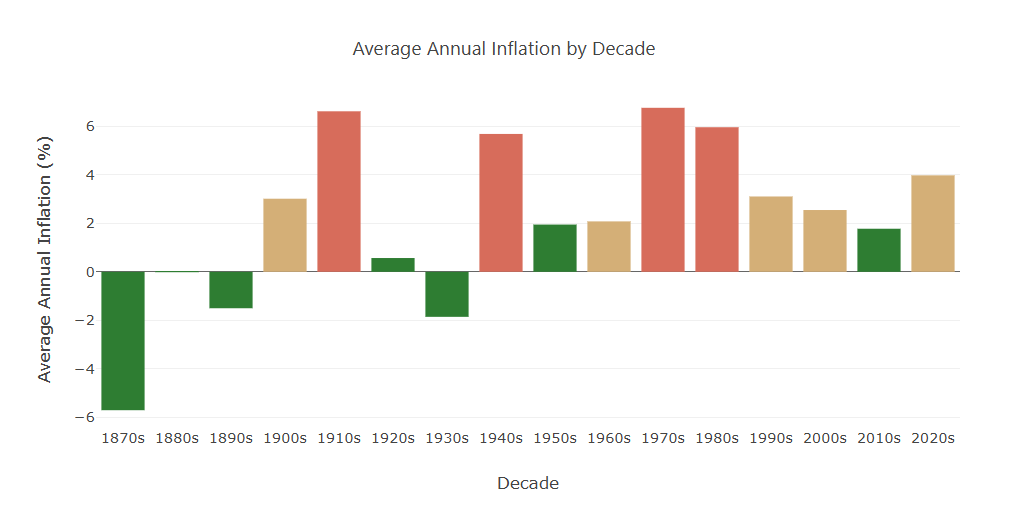
Clearly, neither of these is constant.
Finally, the formula gives you a single number. But even if this number reflects the "average" historical return, you are very unlikely to hit exactly that average. You may end up significantly higher or lower. History shows that past savers faced wildly different outcomes depending on when they started. Given the randomness in market returns, the range of outcomes is substantial.
Why Sequence Matters During Accumulation
Most people know about sequence risk in retirement: bad early returns hurt. Fewer recognize that it works in reverse during saving. I touched upon this in the savings lottery post.
In summary, when you're contributing regularly:
-
Early poor market performance → you buy cheap, you may recover later (good)
-
Late poor market performance → crashes hit your largest balance (bad)
For savers with the same contributions and same average return, different return sequences imply different outcomes.
Let's look at two savers. Both save $\$1,000$ per month for 30 years which is invested in the S&P 500. One of them started saving in 1949 and the other in 1969. Look at their their portfolio paths in the following charts, figures 3 and 4.
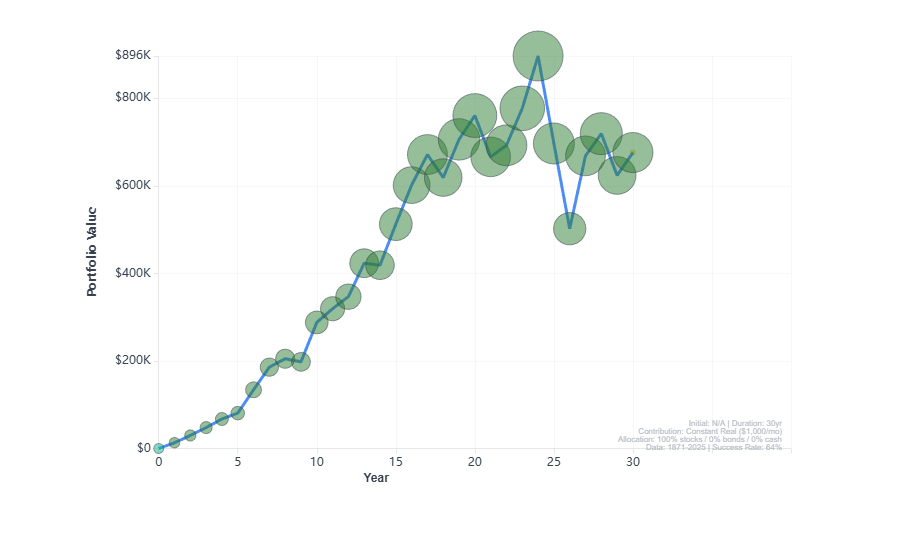
For the path starting in 1949 we have:
Good Start → Bad Finish (best first 10 years, worst last 10 years)
- First 10 years (1949-1959): +17.6% CAGR (post-war boom, Korean War recovery)
- Last 10 years (1969-1979): -2.9% CAGR (stagflation, oil crisis, Vietnam)
End Portfolio result: $\$675,963$
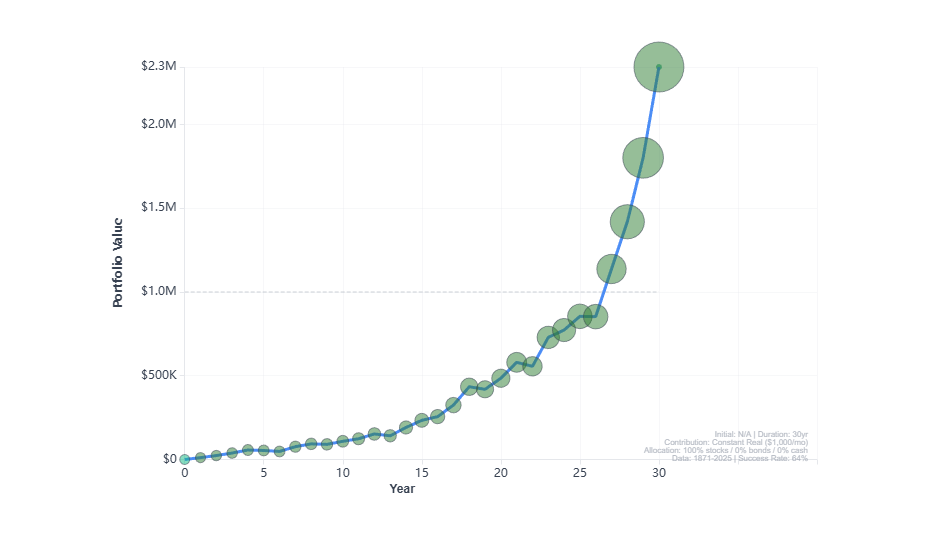
While, for the path starting in 1969:
Bad Start → Good Finish (worst first 10 years, best last 10 years)
- First 10 years (1969-1979): -2.9% CAGR (stagflation, oil crisis)
- Last 10 years (1989-1999): +15.4% CAGR (tech boom, globalization)
End Portfolio result: $\$2,342,478$
The most striking part of this difference between $\$675,963$ and $\$2,342,478$ is not the numbers themselves. Afterall, there are bound to be better and worse periods in history. It is that the overall S&P 500 performance over these periods was practically the same, $7\%$!
The compounded annual S&P 500 performance in both 30-year periods (CAGR) is about 7%. So, the 3x+ difference in the saver's portfolio is entirely because of the sequence of returns difference and not because of overall market performance!
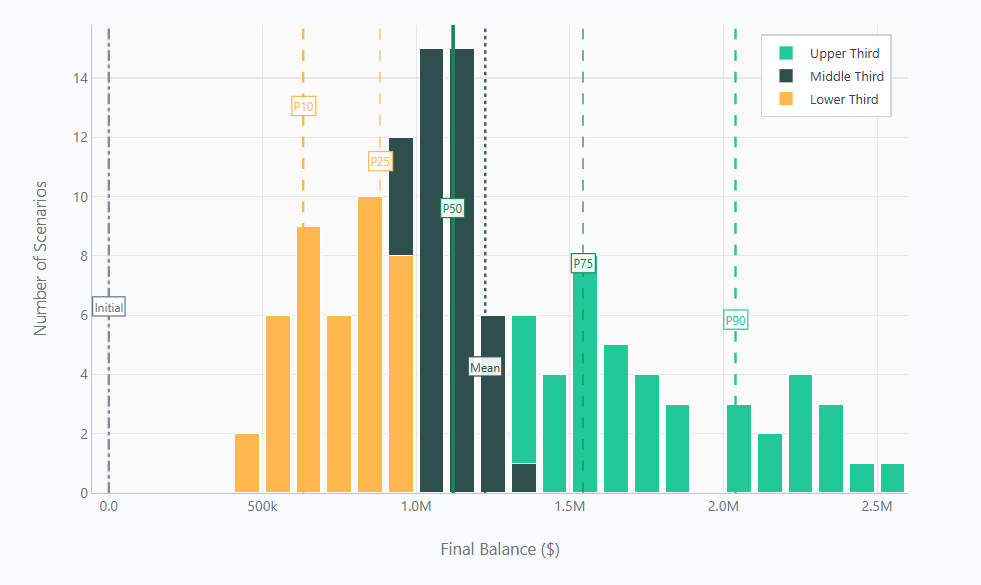
What History Actually Shows
Using $150$ years of real market data, we ran the same savings strategy across every historical starting year for the US market. For simplicity, we assume everything is invested in the S&P 500.
The historical average real return over 150 years is about $6.8\%$. So, the $7\%$ used in the simple formula above is reasonable and the result we got is close to the median historical outcome. But the range paints a different picture:
| Scenario | Terminal Balance |
|---|---|
| Worst historical outcome | $\$422K$ |
| Median outcome | $\$1,120K$ |
| Best historical outcome | $\$2,534K$ |
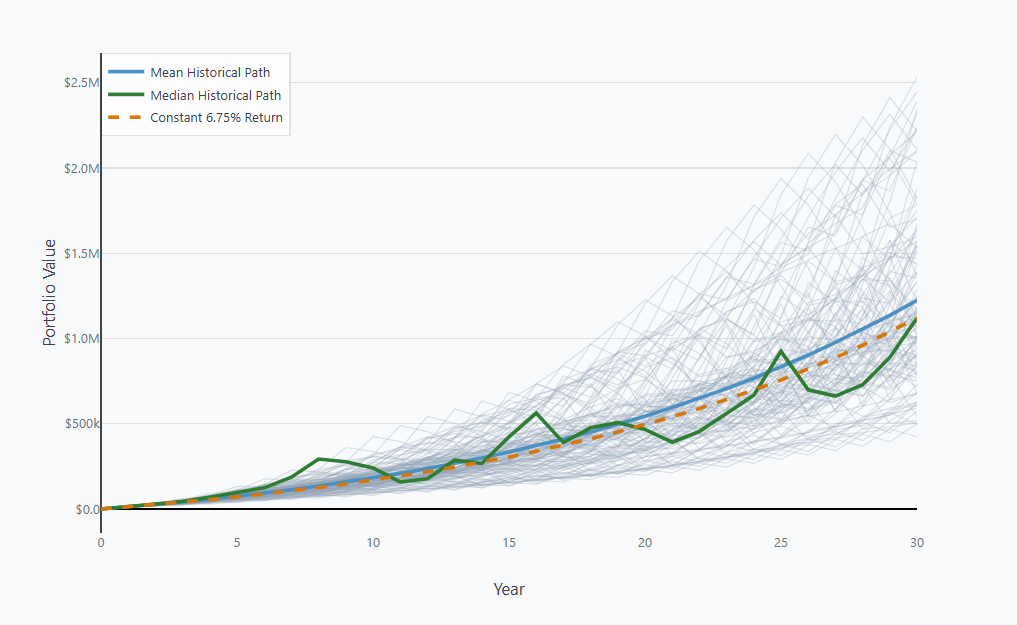
It is not so much that the simple formula is wrong about the average or median. We are wrong when we assume we'll get the average or median when we may do dramatically better or dramatically worse.
So Is the Formula Useless?
No. If you use the right number, you get the historical outcome: roughly, what history delivered. That's useful for ballpark planning.
But it tells you nothing about:
- How bad could it get?
- How likely am I to hit my target?
- What's the range of realistic outcomes?
The formula answers: "What happens in an average world?"
Historical simulations answers: "What has actually happened to real savers?"
A Better Way to Think About Savings
Instead of: "Save $X$ to get $Y$"
Think: "Save $X$ to have a $Z\%$ chance of reaching $Y$"
This is what Bellavia does. Rather than assuming constant returns, it runs your strategy through every historical period and shows you the historical distribution of outcomes.
You still get a median number—one that accounts for historical inflation. But you also get:
- Confidence bands
- Worst- and best-case scenarios
- Understanding the uncertainty
- What years and conditions lead to best/worst outcomes
- How bonds change the risk/reward tradeoff
- The actual historical paths, not just the average
Closing
The formula isn't wrong—it's incomplete. It gives you the destination without telling you about the weather.
For serious planning, you need both: the expected outcome and the range of possibilities. That's what separates robust planning from wishful thinking.
References & Sources
Formula Background
Future Value of Annuity - The standard compound interest formula for regular contributions, used in virtually all retirement calculators
Accumulation Phase Research
Wade Pfau - Pfau, W.D. (2011). Safe Savings Rates: A New Approach to Retirement Planning over the Life Cycle. Journal of Financial Planning, 24(5), 42-50
Sequence of Returns Risk - Pfau, W.D. & Kitces, M.E. (2014). Reducing Retirement Risk with a Rising Equity Glide Path. Journal of Financial Planning, 27(1), 38-45
Historical Market Data
- US Market Data: Robert Shiller's U.S. Stock Markets 1871-Present and CAPE Ratio, Yale University
Bellavia Insights
Join Our Retirement Insights Mailing List
Get exclusive historical analysis and retirement planning insights delivered to your inbox:
- Deep dives into historical market cohorts
- Withdrawal strategy analysis and best practices
- Early access to new features and research
Free insights. Unsubscribe anytime.
Discussion (0)
Join the conversation
Log in to commentNo comments yet. Be the first to share your thoughts!