Historical 90% and Monte Carlo 90% Are Not the Same Number
Historical 90% and Monte Carlo 90% Are Not the Same Number Even when both say 90% success and displayed the same way, they do not …
Expert analysis on historical simulation, withdrawal strategies, and financial independence planning
Historical 90% and Monte Carlo 90% Are Not the Same Number Even when both say 90% success and displayed the same way, they do not …
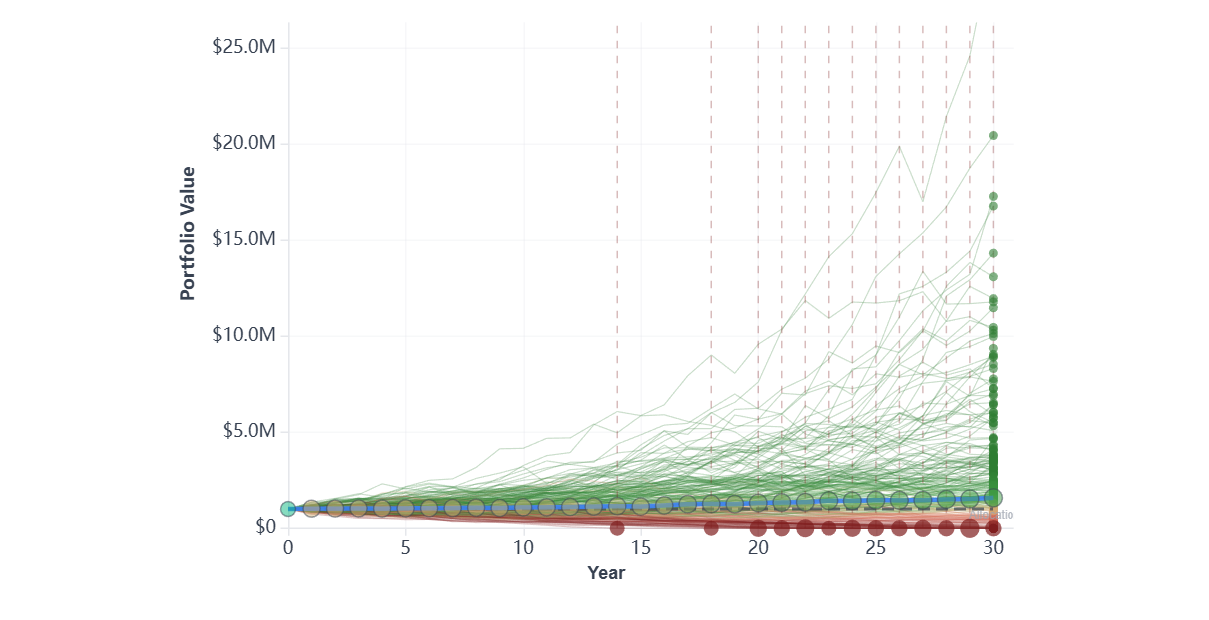
You ran a retirement simulation and got two results. The historical backtest says 98.9% success. The Monte Carlo says 90.5%. Which one is right? Both. …

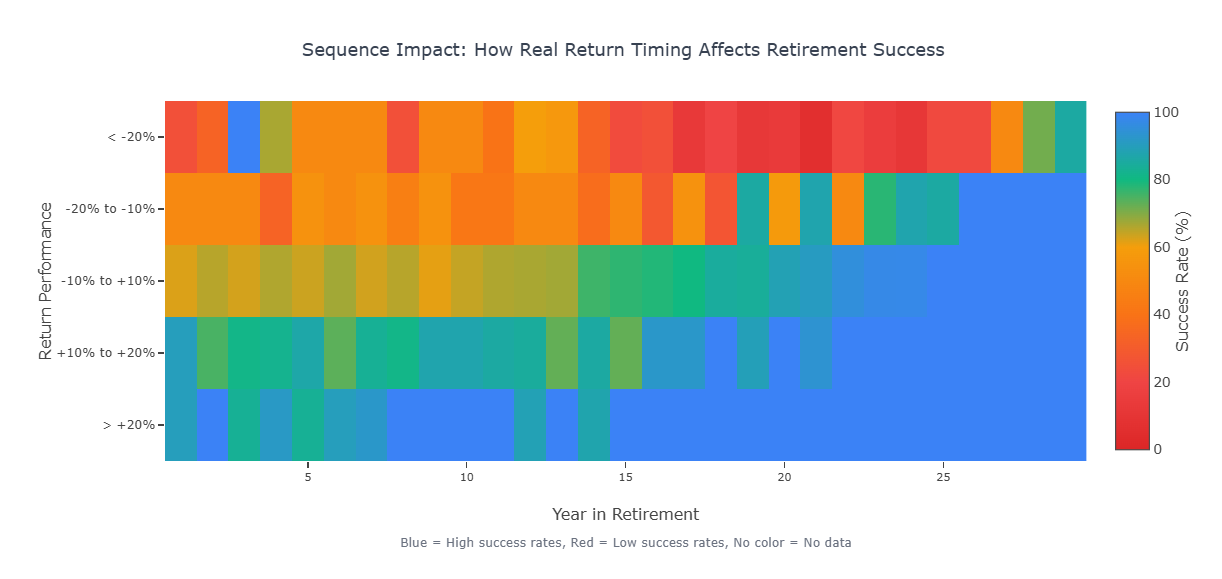
The 1966 retiree could safely withdraw 3.9% annually (adjusting for inflation). The 1982 retiree could safely withdraw 11.8%, a full three times more spending power …
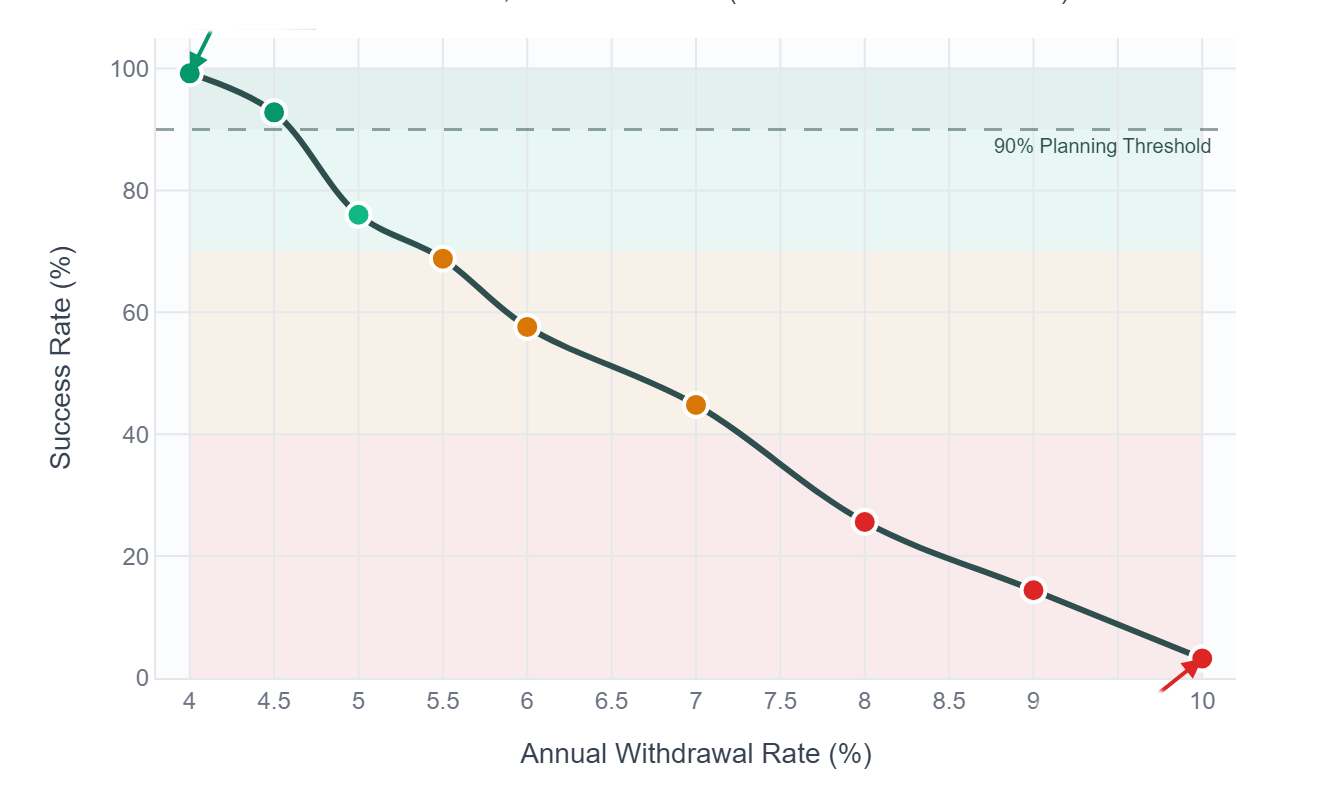
When planning for retirement, small differences in withdrawal rates can have dramatic impacts on portfolio longevity. This analysis explores what happens when you increase your …
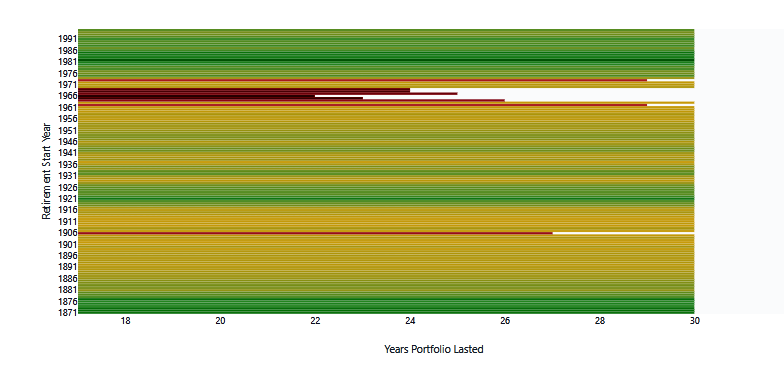
1966 was worse than 1929. We tested how the same $1M portfolio performed starting in four of history's riskiest retirement years. Two failed completely. Two …
A step-by-step guide to accessing and formatting the Jordà-Schularick-Taylor Macrohistory Database for use in Bellavia's retirement planning simulations. This comprehensive dataset spans 1870-2020 and includes …
Looking to use the renowned Robert Shiller data for your retirement planning simulations? While Bellavia comes with built-in US and UK market data from 1900-2020, …
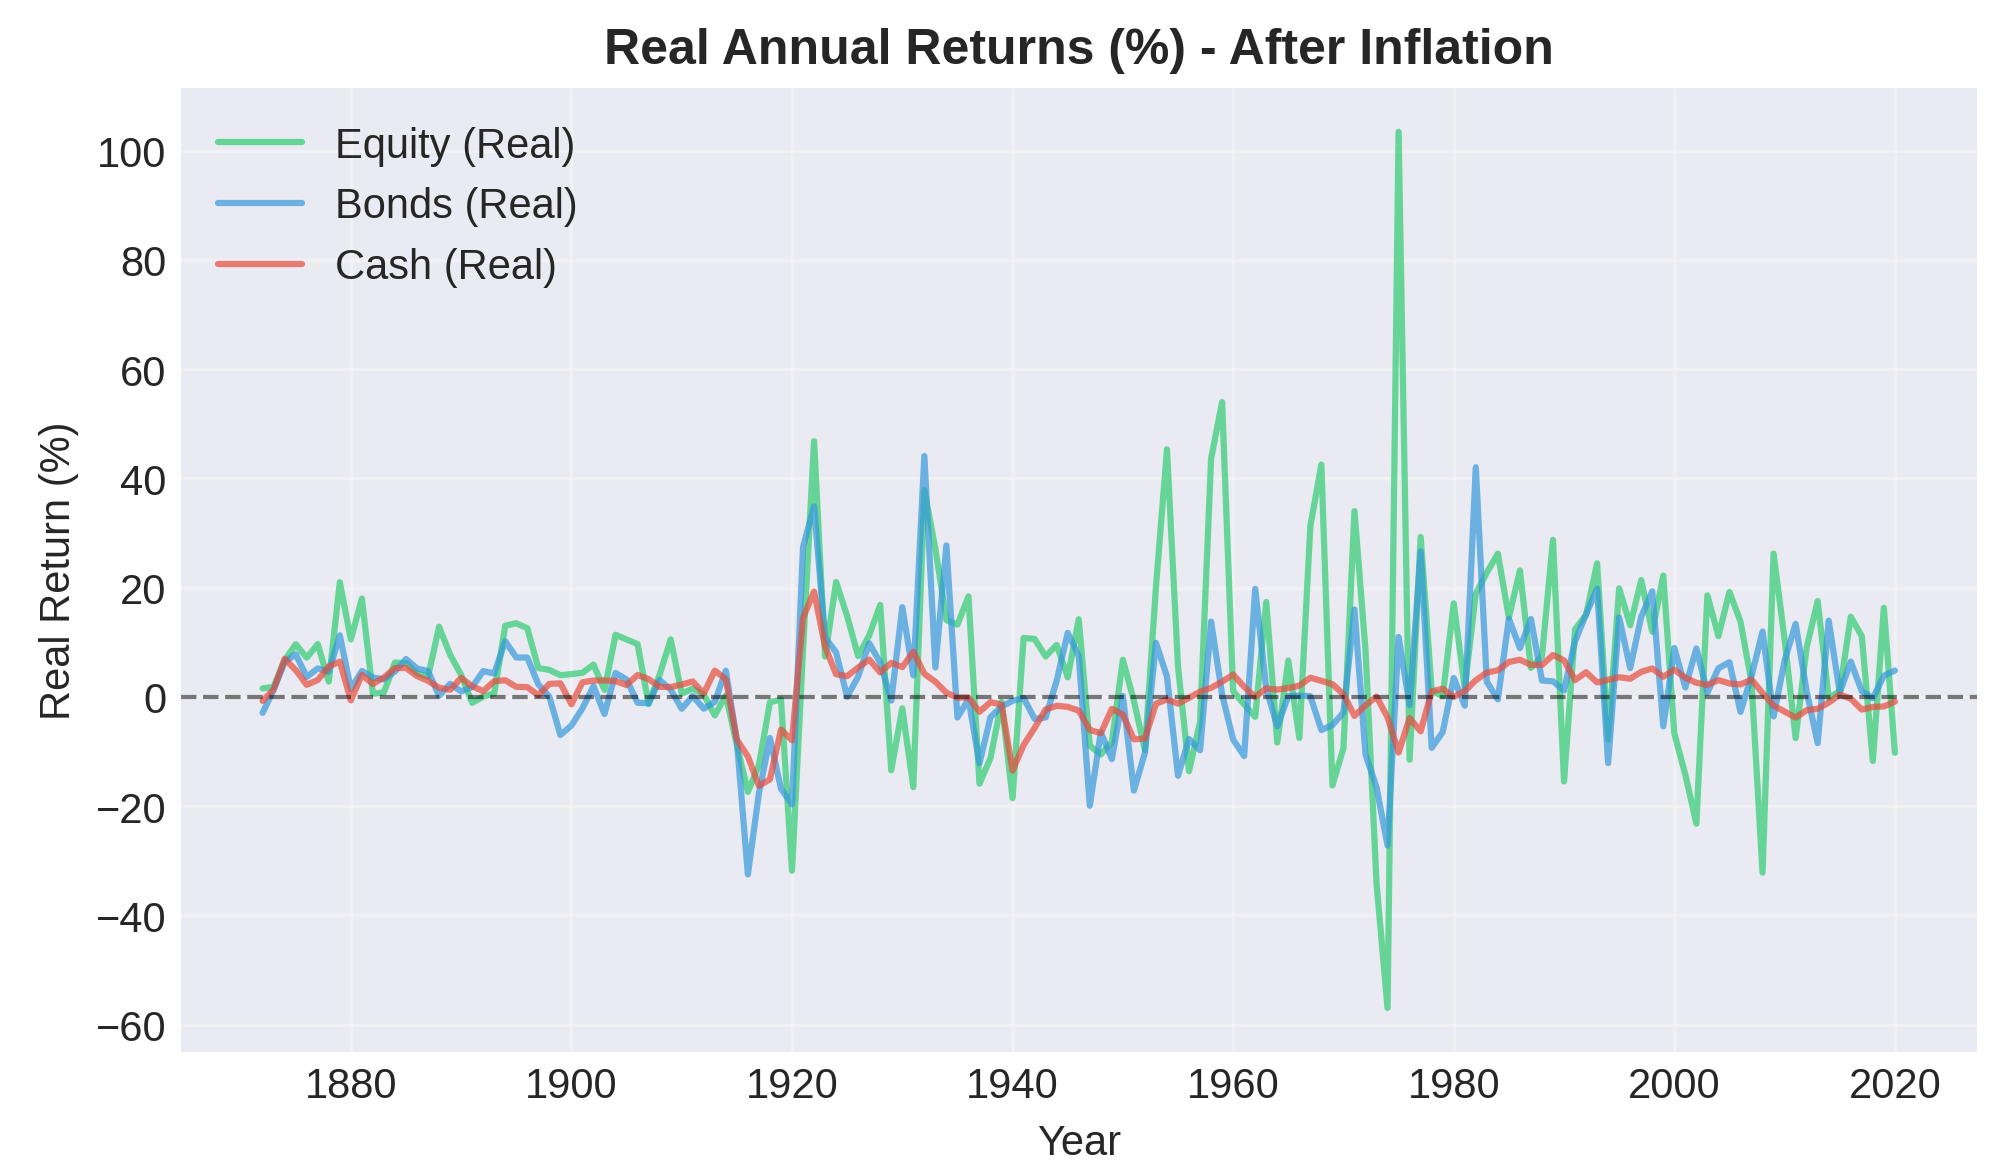
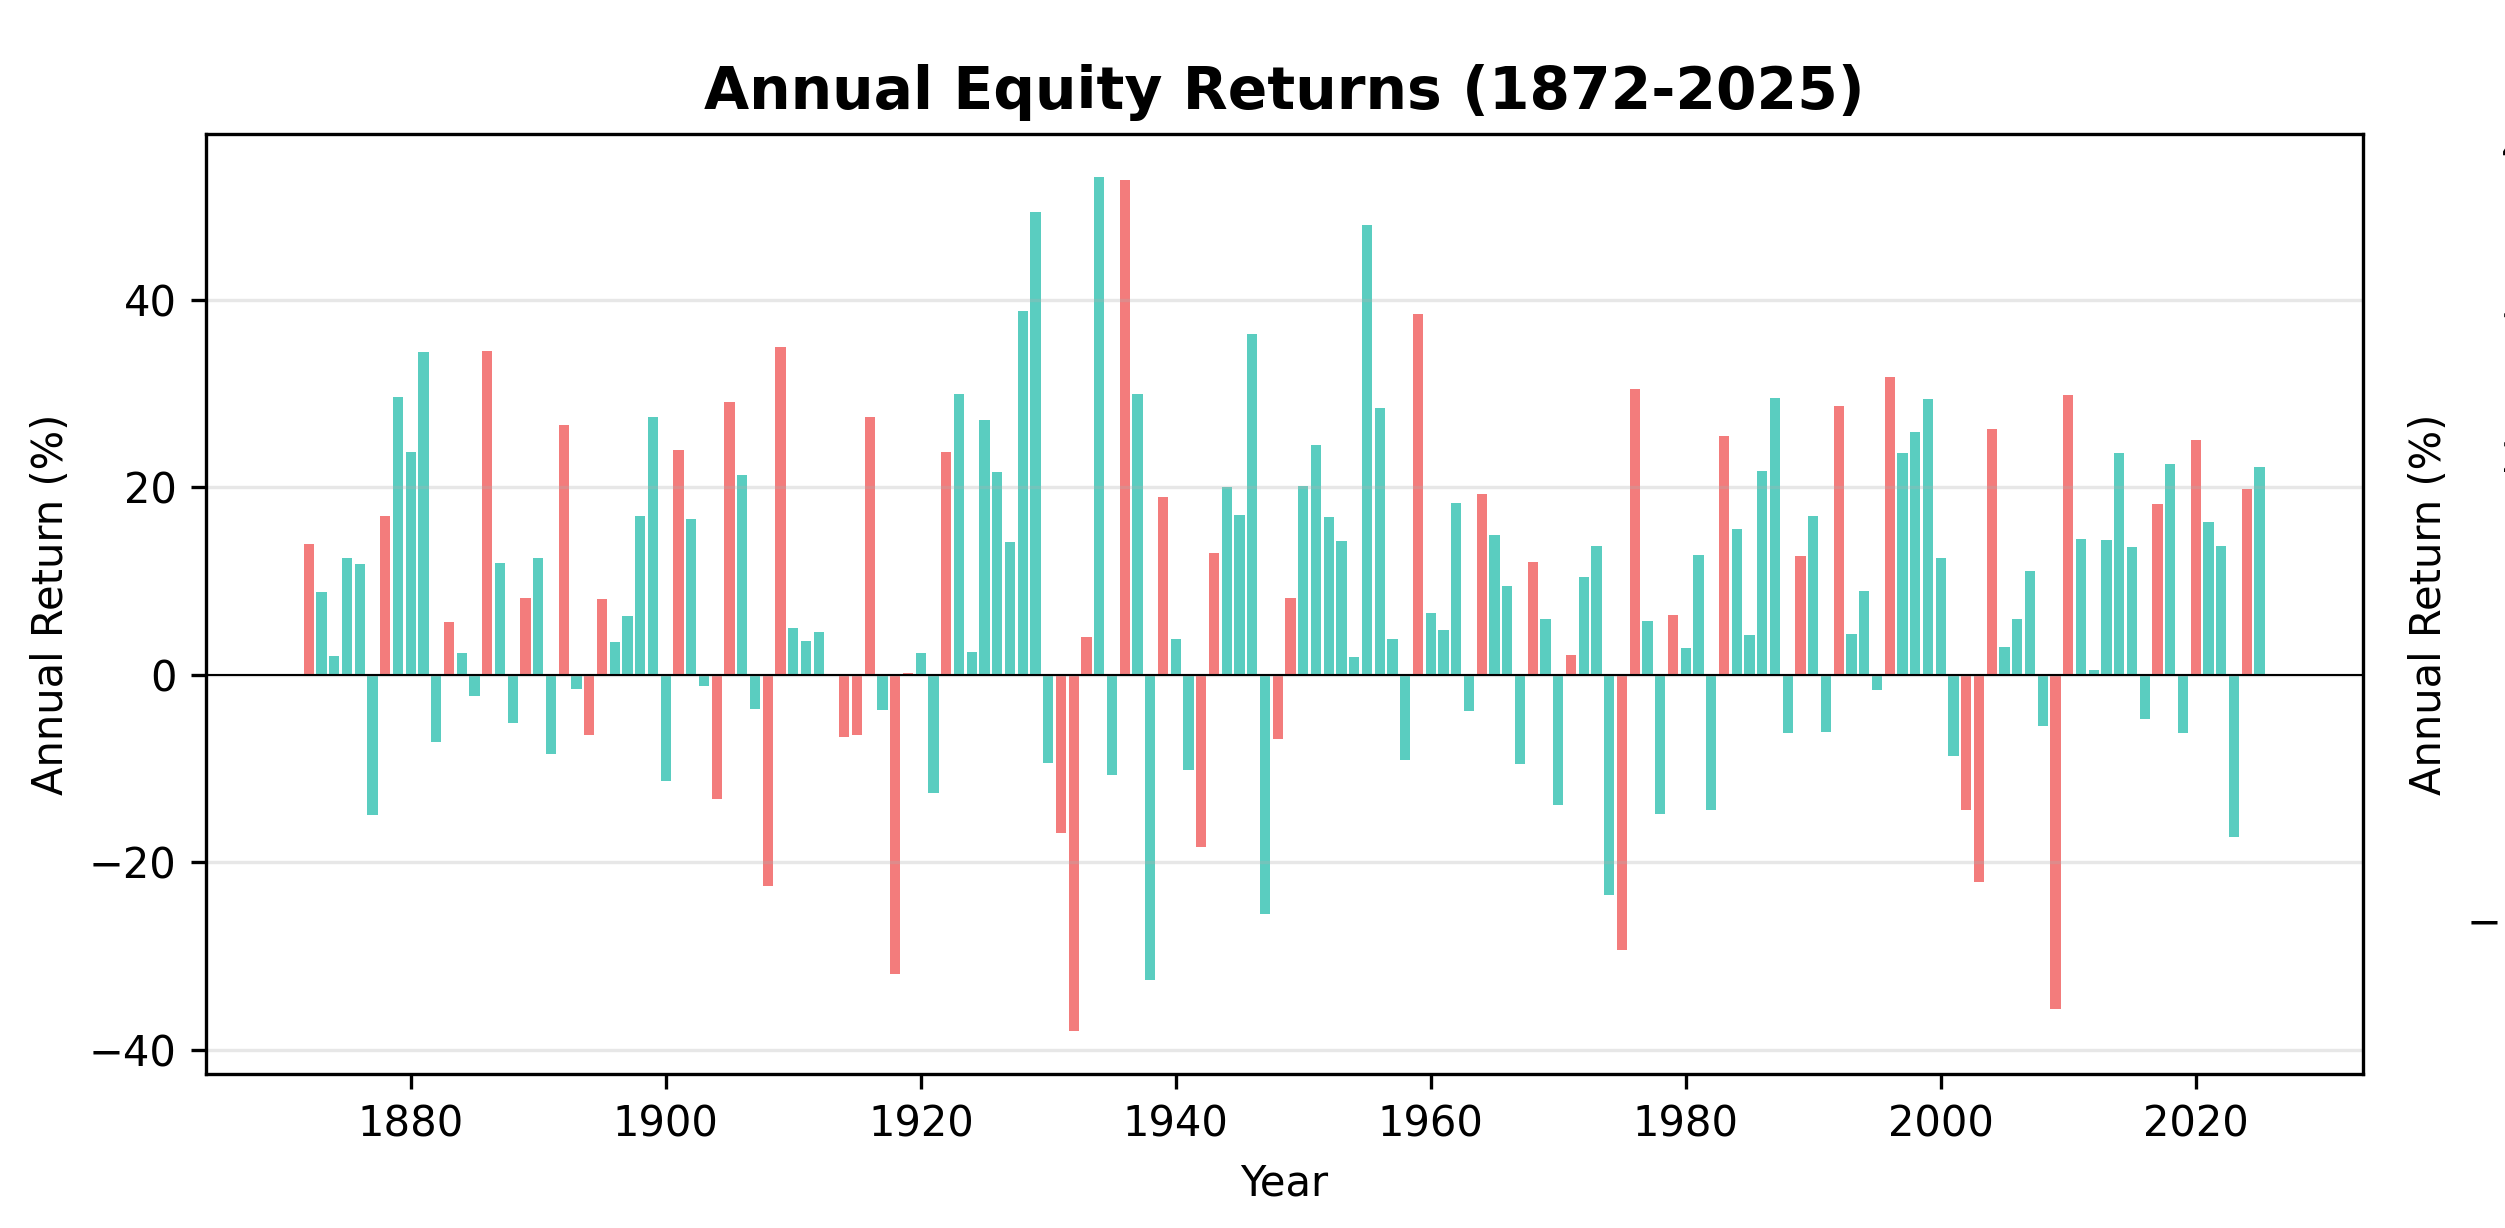
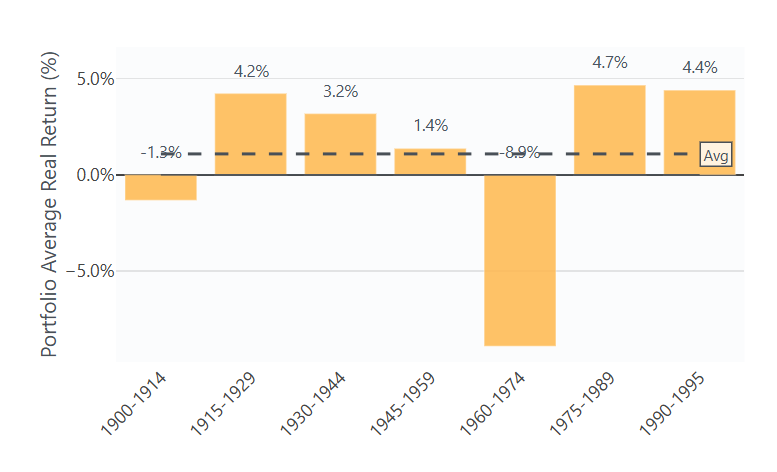
Historical data gives us the only empirical laboratory we have. It tells us how portfolios behaved through war, depression, inflation, stagnation, and exuberance. Without these …
Looking to analyze your retirement portfolio with real historical data? While Bellavia.app includes US and UK market data from 1900-2020, you can do even better. …