At first glance, this may sound paradoxical. Markets evolve, economies change, and tomorrow rarely looks like yesterday. Yet the only solid foundation for every retirement plan, every investment strategy, and every safe withdrawal rule is historical experience: the record of how markets, inflation, and human behavior have interacted over time.
1. The Past as Laboratory
Historical data gives us the only empirical laboratory we have. It tells us how portfolios behaved through war, depression, inflation, stagnation, and exuberance. Without these lived cycles, we would be planning blind.
At Bellavia, we use long-term historical data, stretching back more than a century, to simulate possible retirement paths. The idea is simple: by studying what has actually happened, we gain insight into what could happen again.
2. Beyond Averages: The Sequence of Returns
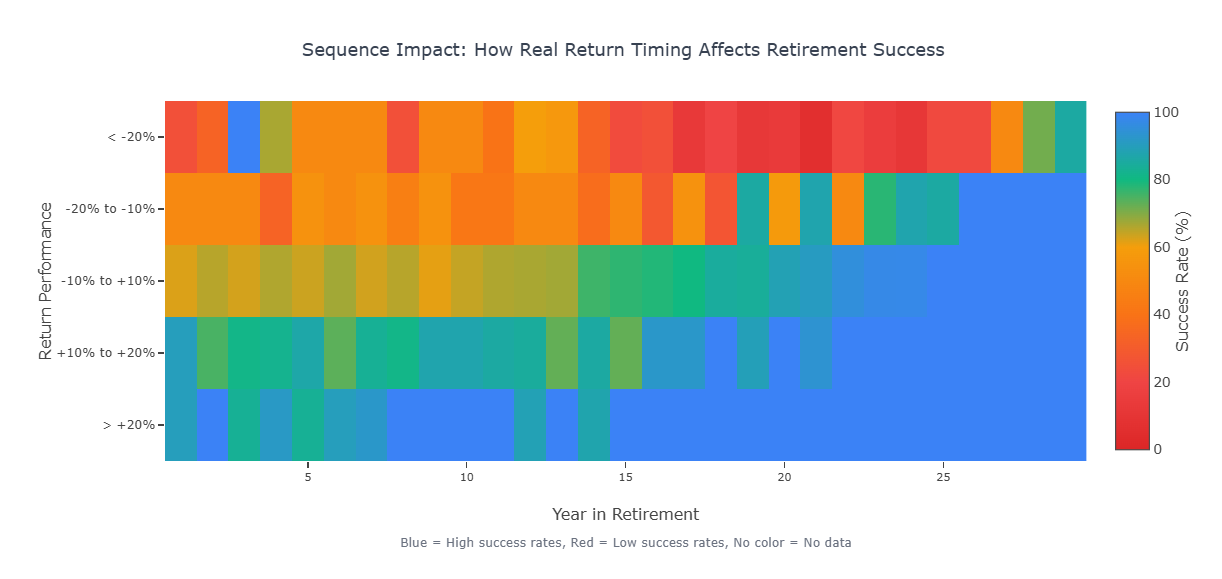
Average returns can be deceiving. Two portfolios may have the same average growth, yet when withdrawals are involved, they can behave differently depending on the sequence of gains and losses. This is an effect that can be seen in our analysis of sequence return risk.
Historical data captures this nuance. It shows not just how much markets return on average, but how volatility, inflation, and timing interact. This is why Bellavia's simulations are based on real historical sequences, not just statistical noise. This helps users evaluate the actual behaviour of markets: the years that tested investors' patience and those that rewarded it.
3. A Global Record, Not a Single Story
No country tells the whole truth. U.S. market history is exceptional but not universal. That's why Bellavia gives you the possibility to upload datasets from multiple sources. You can use Shiller's U.S. market data, the Jordà–Schularick–Taylor Macrohistory Database, and the Dimson–Marsh–Staunton global returns series covering more than 30 countries and 150 years. Or you can use the demo datasets for US and UK.
By simulating across regions and currencies, Bellavia helps retirees see how outcomes vary under different economic regimes. What happens if inflation resembles the 1970s? Or if real returns mirror post-war Europe rather than the late 20th-century U.S.? Historical data provides the texture that makes these questions meaningful.
4. Realism Over Optimism
Using historical data doesn't predict the future, but it disciplines our imagination. It keeps us anchored to what markets have actually delivered, reminding us that risk is not just an abstract concept, it's a pattern.
The purpose here is not to repeat the past but to understand its range. Historical data defines the boundaries within which prudence and resilience operate. It tells us what has been possible, and what has not.
5. Why It Matters for You
Every retirement plan depends on assumptions: returns, inflation, longevity. Historical data makes these assumptions visible. It allows you to stress-test your plan against real-world history, to see how it holds up under decades of change.
At Bellavia, our goal is to make this process transparent and empowering. Each simulation is not a forecast but a way to learn from the market's collective memory before making deeply personal financial decisions.
But of course, retirement planning doesn't start at retirement. Before you draw down, you must build up—and here too, history is your ally.
6. Building Up Before Drawing Down
Before one reaches the stage of managing, investing, and spending one's savings, there is its mirror problem: how to build it up in the first place. Here too, history is indispensable, and Bellavia's approach reflects that symmetry.
Most savings projections assume a constant growth rate, often a tidy number like 5% or 7% per year. This makes calculations easy but dangerously smooth. Real markets don't grow like clockwork. Compounding still works, but it works through the storm, not above it.
Bellavia's Savings Calculator takes a different approach. Instead of treating future returns as fixed, it asks: what if the future looked anything like the past? Assuming a mixture of equities and bonds, the calculator runs through the full record of historical returns, generating many possible accumulation paths. Each path represents an actual realization, and together they sketch the full range of what saving could realistically achieve according to history.
This approach helps users see how contribution patterns, risk tolerance, and market conditions interact over time. It turns saving from an abstract formula into an experiential model, one that recognizes uncertainty not as a flaw but as a fact of life.
Just as Bellavia uses history to illuminate the decumulation years, it uses history to guide the accumulation journey as well. The result is a consistent philosophy: whether you are building your future or living from it, the same evidence-based realism applies.
In both directions, Bellavia's goal is simple: to get the most out of the available history in assessing the present, grounded not in wishful thinking, but in what the markets have already taught us.
In Summary
History does not repeat itself, but it teaches lessons. Bellavia listens carefully to those lessons. Because when it comes to saving or spending, the past isn't nostalgia, it's knowledge.
Recommended References and Data Sources
- Robert Shiller's Irrational Exuberance dataset (Yale University)
- The Jordà–Schularick–Taylor Macrohistory Database (CC BY-NC-SA 4.0)
- Dimson, Marsh & Staunton's Global Investment Returns Yearbook (Credit Suisse Research Institute)
- Official inflation and bond yield data from the U.S. Bureau of Labor Statistics, the Bank of England, and OECD
Discussion (0)
Join the conversation
Log in to commentNo comments yet. Be the first to share your thoughts!