Beyond the 4% Rule: What Questions Need Answers?
A bunch of new questions came up as I was writing previous articles and I want to try to use Bellavia Analytics to address them. We do know that a 4% constant withdrawal rate is in some sense the "golden standard" among constant withdrawal rates. Admittedly, choosing 4.5% for a previous analysis was arbitrary, trying to strike a balance between 4% that almost guarantees success and higher rates that would result in many more failures.
This brings me to the first question: What would have happened if we had used a higher constant withdrawal rate? What would have been the patterns of failure? What would be the most vulnerable times? To answer these questions, I have repeated the same experiment with different rates from 4% to 12%.
The 4% Baseline: Nearly Guaranteed Success
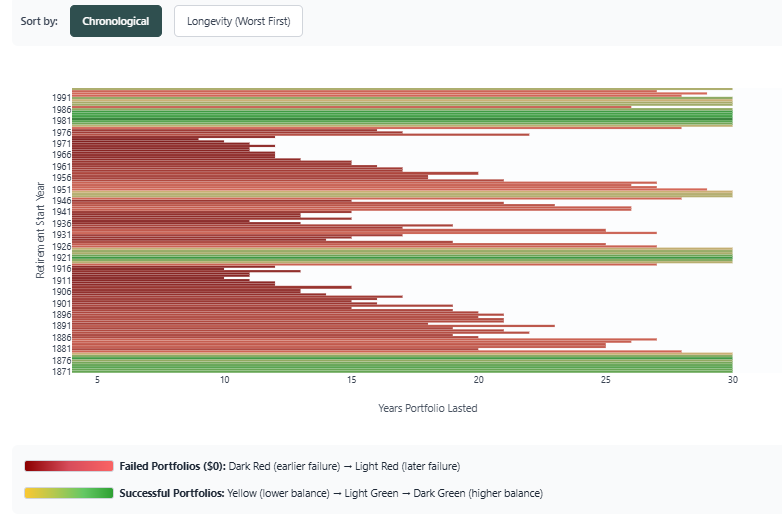
Just as a reminder, this is the portfolio "longevity" chart for each retirement year assuming 4% annual withdrawal rate, adjusted yearly for inflation:
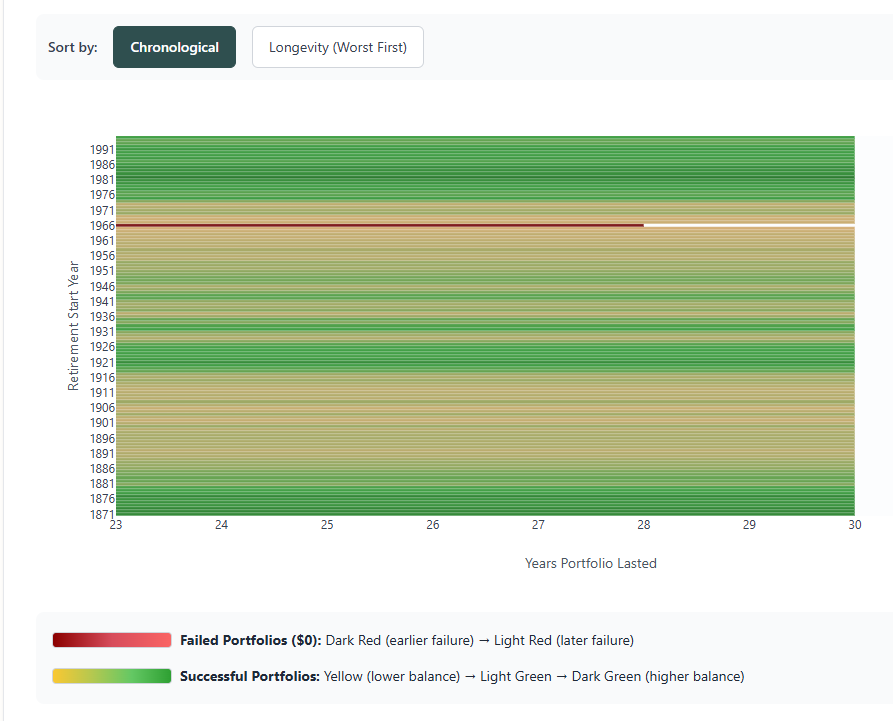
[Chart created with Bellavia Premium] Portfolio longevity for 4% annual withdrawal rate across all historical retirement start years (1871-1991)
The Impact of Higher Withdrawal Rates
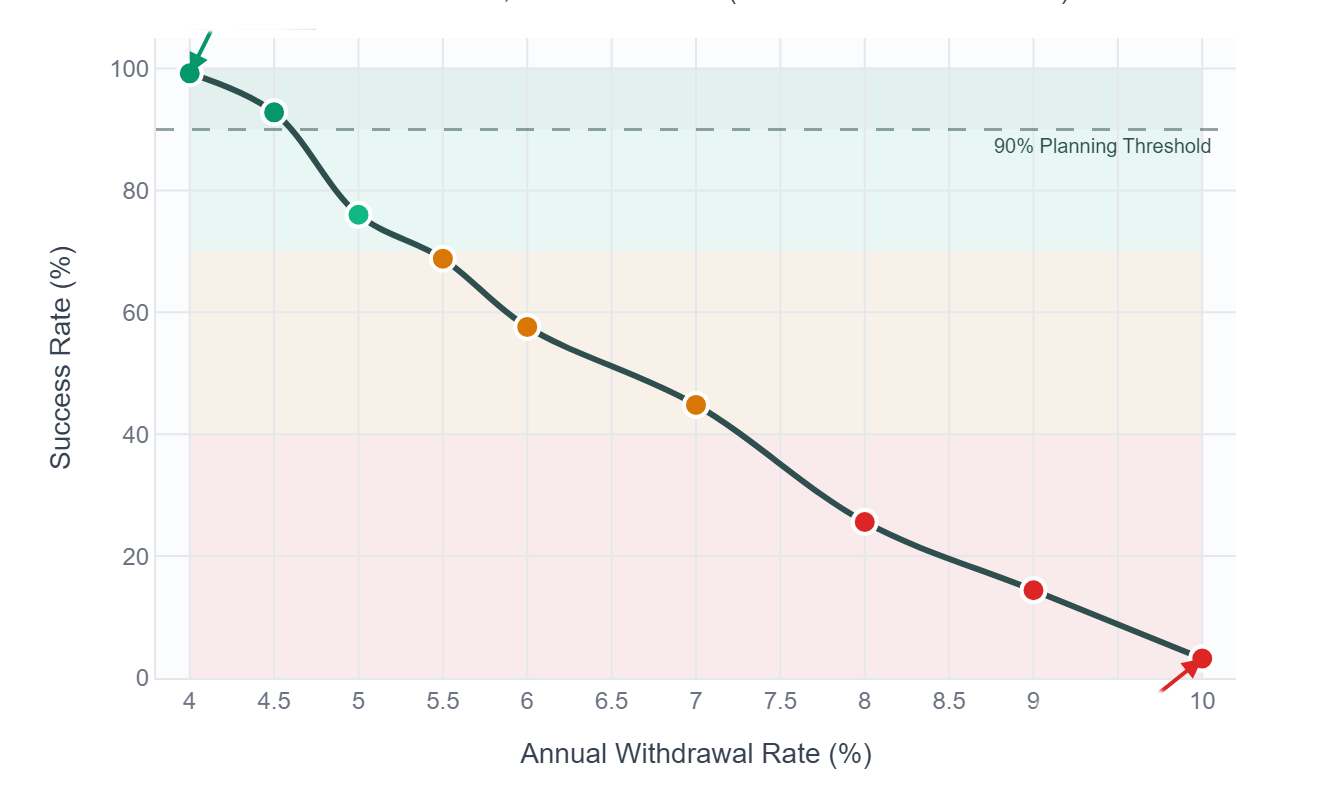
In the table below we see that if we increase the annual withdrawal rate, the success rates plummet from 99.2% to 3.2%.
| Withdrawal Rate | Success Rate | Risk Level |
|---|---|---|
| 4.0% | 99.2% | Very Safe |
| 4.5% | 92.8% | Usually Safe |
| 5.0% | 76.0% | Moderate Risk |
| 5.5% | 68.8% | Risky |
| 6.0% | 57.6% | Very Risky |
| 7.0% | 44.8% | High Risk |
| 8.0% | 25.6% | Extreme Risk |
| 10.0% | 3.2% | Near Certain Failure |
This effect can be better seen in the following chart: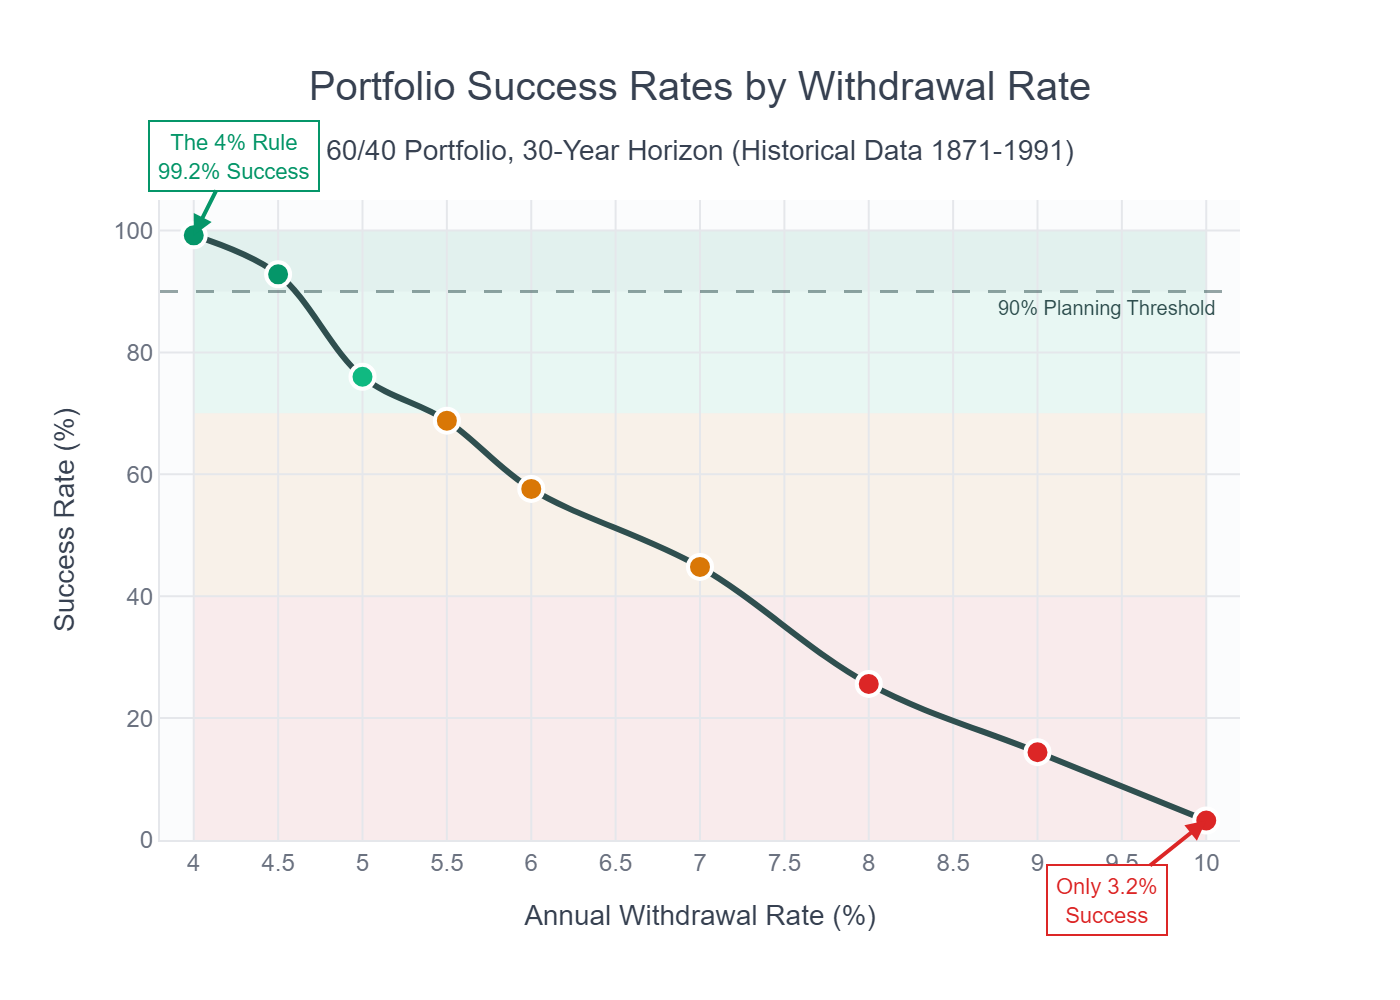
[Chart created with Bellavia Analytics] The dramatic decline in portfolio success rates as withdrawal rates increase beyond 4%
Notice how small increases in withdrawal rates lead to disproportionately large drops in success rates. The portfolio crosses below the critical 90% planning threshold between 4% and 4.5%, and falls below 60% success by 6%. This isn't a gentle slope—it's a cliff.
This is what the longevity patterns look like when increasing these withdrawal rates. First, portfolio longevity first at 6% withdrawal rate:
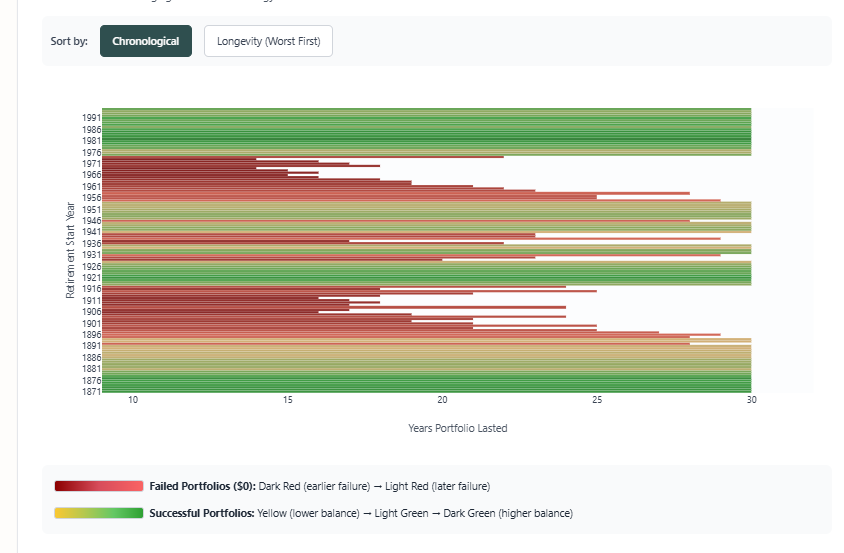
[Chart created with Bellavia Premium] Portfolio longevity for 6% annual withdrawal rate — notice the significant increase in failures
Then at 8% withdrawal rate:
[Chart created with Bellavia Premium] Portfolio longevity for 8% annual withdrawal rate — only 1 in 4 portfolios survive 30 years
And finally: 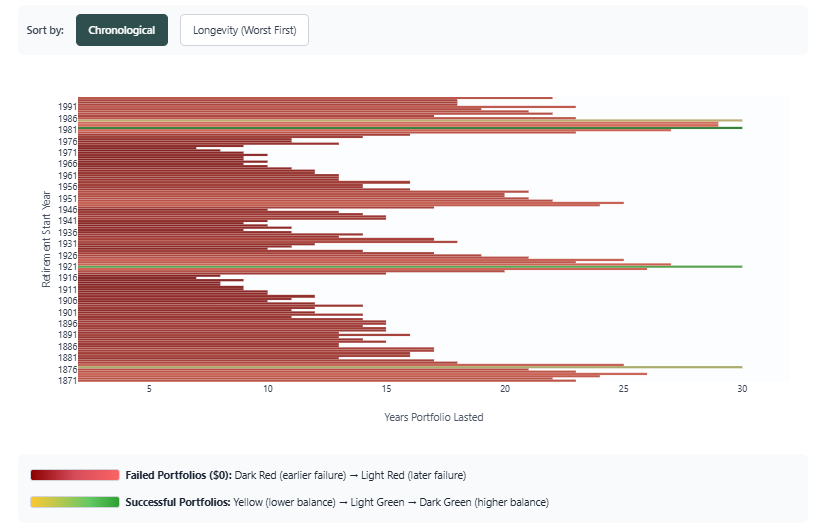
[Chart created with Bellavia Premium] Portfolio longevity for 10% annual withdrawal rate — near universal failure within 20 years
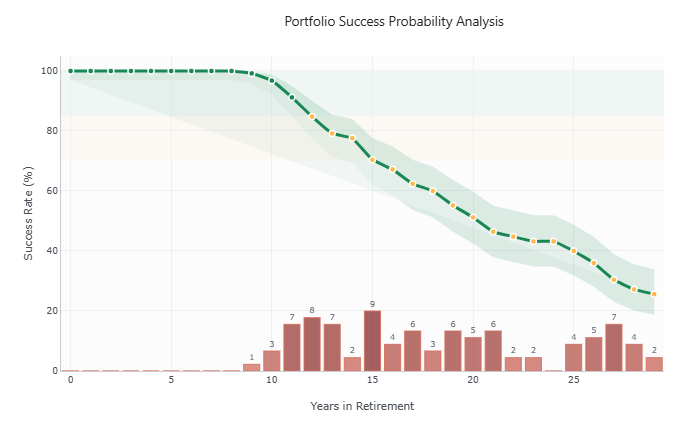
When Do Failures Occur? The 6% Case Study
As the withdrawal rate increases, the chances that the portfolio runs out of money increase. For example, for the 6% withdrawal we have the following pattern of failures over time:
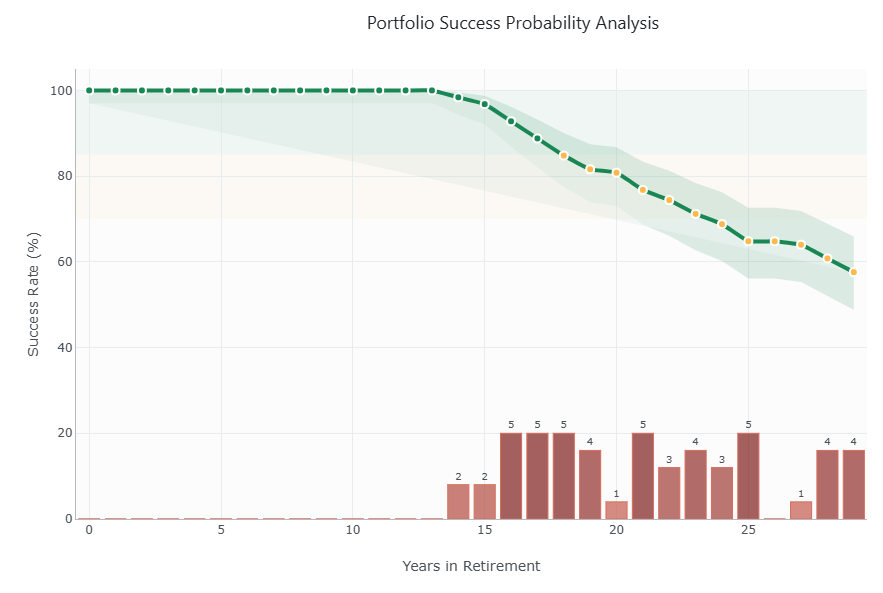
[Chart created with Bellavia Analytics] Portfolio success probability over time — 6% withdrawal rate. Failures begin appearing at year 14 and accelerate after year 16.
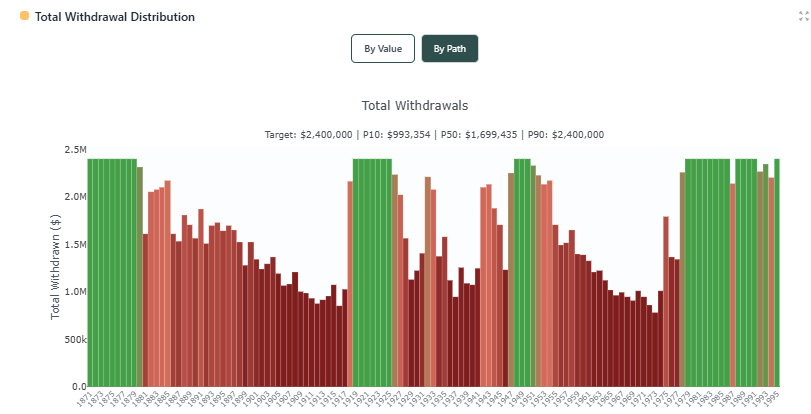
Where we can see the years where failures happen, they start on year 14 with 2 paths failing (each path represents a starting year) with failures accelerating after year 16. For the same 6% withdrawal rate, the total withdrawal amount from the portfolio per starting year can be seen in the following chart:
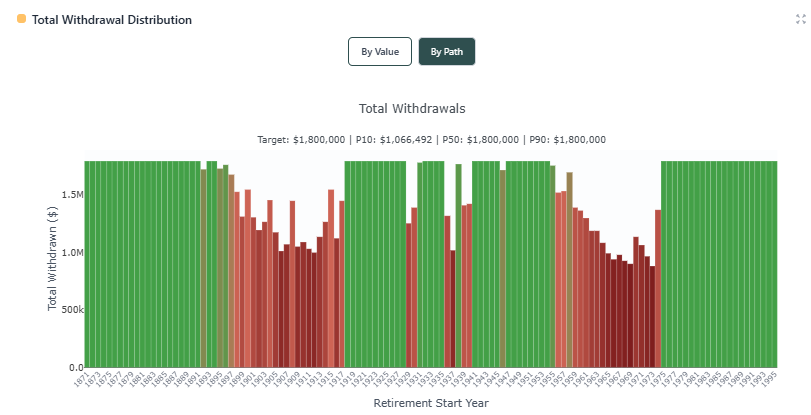
[Chart created with Bellavia Premium] Total withdrawals by retirement start year — 6% withdrawal rate. Green bars show successful periods; red shows failures.
The 8% Withdrawal Rate: Earlier Failures
For a higher rate, the patterns become even more concerning:
[Chart created with Bellavia Premium] Portfolio success probability over time — 8% withdrawal rate. Failures now begin at year 9.
Portfolio failures here started on year 9, and the total withdrawals looked like this:
[Chart created with Bellavia Premium] Total withdrawals by retirement start year — 8% withdrawal rate. Many failed portfolios extracted only about half the target amount.
Not All High Withdrawal Rates Fail: The Resilient Periods
Before we conclude that higher withdrawal rates are universally doomed, it's worth looking at the other side of the story. If you look closely at the 8% withdrawal rate chart above, you'll notice something important: there are periods where even this aggressive strategy succeeded. Specifically, retirees who started in the early 1980s and much of the 1990s managed to sustain 8% withdrawals for the full 30 years.
What made these periods different? The answer lies in the starting conditions they faced. The early 1980s marked the end of one of the worst periods in market history—the 1970s stagflation era had left stock prices depressed and valuations low. When Paul Volcker's Federal Reserve finally tamed inflation in the early 1980s, it set the stage for one of the greatest bull markets in history.
Someone retiring in 1982 with an 8% withdrawal rate caught the entire 1982-2000 bull run, including the spectacular gains of the 1990s tech boom. This reveals something crucial about withdrawal rates: context matters enormously. The same 8% withdrawal rate that devastated a 1966 retiree enriched a 1982 retiree.
The difference wasn't luck—it was starting valuations and the subsequent market trajectory. Low valuations at retirement provided a margin of safety that high valuations simply don't offer. This is why tools that rely purely on average returns can be misleading; they miss the critical importance of when you retire relative to market cycles.
I want to be clear: I'm not suggesting anyone should plan on 8% withdrawals hoping to catch the next 1982. Rather, this historical reality shows us that retirement success isn't purely about choosing the "right" number—it's about understanding the conditions you're facing and being prepared to adapt. Some periods can tolerate aggressive strategies; others demand caution.
Key Findings
The charts above illustrate these critical points:
- Seemingly small changes in withdrawal rates can have a big effect on portfolio survival. The difference between a 4% and 6% withdrawal rate is just 2 percentage points, yet success rates drop from 99.2% to 57.6% — a dramatic 40+ percentage point decline in reliability.
- Higher withdrawal rates can mean withdrawing less overall! By withdrawing too much at the start, we may end up withdrawing less overall. The charts show that many failed portfolios at 8% withdrawal rates only managed to extract about half of the target amount over their lifetime before running out of money. This counterintuitive result means that aggressive withdrawal strategies can actually reduce your total lifetime income.
- Timing matters as much as the withdrawal rate. Historical periods with favorable market conditions (low starting valuations, strong subsequent returns) could sustain much higher withdrawal rates than periods with poor starting conditions. This emphasizes the importance of understanding sequence of returns risk.
- Failures cluster in specific retirement cohorts. The 1960s and early 1970s retirement cohorts consistently showed the highest failure rates across all withdrawal levels, due to the combination of high initial valuations, poor stock returns, and elevated inflation during that period.
What This Means for Your Retirement Plan
So where does all of this leave us? I think there are a few important takeaways from this historical analysis.
First, the 4% rule isn't arbitrary—it's optimized for surviving the worst historical sequences. That 99.2% success rate we saw earlier exists because 4% was specifically designed to withstand even the brutal 1966 retirement scenario. When financial planners recommend 4%, they're essentially saying "this worked even when everything went wrong." That's valuable insurance, even if it feels conservative.
But second—and this is crucial—context matters. The 4% rule assumes you'll never adjust your spending regardless of market conditions, that you'll mechanically increase withdrawals for inflation every year, and that you're planning for a worst-case scenario. Real life is more nuanced.
The patterns we've seen today also highlight why dynamic strategies—approaches that adjust withdrawals based on portfolio performance—can be so powerful. Many of those failures we saw in the 1960s cohort could have been prevented with even modest spending flexibility. Dynamic withdrawal strategies like guardrails can allow higher baseline withdrawals while maintaining safety by making adjustments when needed.
Finally, while historical analysis gives us invaluable perspective (it's the only empirical laboratory we have), your specific situation matters. Your time horizon, risk tolerance, spending flexibility, and other income sources all factor into what's appropriate for you. The goal isn't to find the one "perfect" withdrawal rate—it's to understand the tradeoffs and make informed choices.
Testing Different Withdrawal Strategies
Beyond simply testing fixed withdrawal rates, Bellavia allows you to explore various withdrawal strategies:
- Constant Amount: Traditional inflation-adjusted withdrawals
- Guardrails: Adjust spending up or down based on portfolio performance
- Percentage of Portfolio: Withdraw a fixed percentage each year (eliminates depletion risk but creates income volatility)
- 95% Rule: Adjust spending based on previous year's spending and portfolio performance
- Custom Strategies: Define your own rules for when and how to adjust withdrawals
Each strategy has different tradeoffs between spending stability and portfolio longevity. Historical backtesting reveals which approaches work best under different market conditions.
Next Steps: Beyond Historical Analysis
In future posts, I'll dive into:
- Dynamic withdrawal strategies — how guardrails approaches could have saved many of the failed scenarios we examined today
- Market regime analysis — understanding how different economic periods affect retirement outcomes
- International diversification — testing withdrawal rates using global market data beyond the US
- Asset allocation impacts — how different stock/bond mixes interact with withdrawal rates across history
Until then, I hope this historical perspective helps you think more clearly about your own retirement planning. The beauty of using real historical data is that it shows us what actually happened—not what we hope might happen or what mathematical models predict should happen.
Ready to Test Your Withdrawal Strategy?
Stop relying on generic rules of thumb. See exactly how your specific withdrawal rate would have performed across every market crash, bull run, and economic regime in history.
Test your portfolio with Bellavia:
- Run simulations across 120+ years of real market data
- Compare different withdrawal strategies side by side
- See detailed failure patterns and success probabilities
- Understand sequence of returns risk for your specific plan
- Explore advanced analytics including market regimes and drawdown scenarios
14-day free trial available
Frequently Asked Questions
Why does the 4% rule have such a high success rate?
The 4% rule was specifically designed to survive the worst 30-year period in U.S. market history (the 1966 retirement cohort). By optimizing for the worst-case scenario, it naturally has very high success rates across most other historical periods. However, this conservative approach may leave significant money on the table during favorable market conditions.
If 8% worked for 1982 retirees, why shouldn't I use 8%?
The 1982 retirement cohort benefited from exceptionally favorable conditions: low starting valuations after the 1970s bear market, followed by one of the greatest bull markets in history. You cannot know in advance whether you'll face similar conditions. An 8% withdrawal rate failed in 75% of historical periods. Unless you can predict market conditions with certainty, planning for 8% withdrawals is extremely risky.
How can higher withdrawal rates result in less total income?
When you withdraw too aggressively early in retirement, you may deplete your portfolio before the end of your planning horizon. For example, an 8% withdrawal might seem to provide more income than 4%, but if your portfolio runs out after 15 years, your total lifetime withdrawals will be much less than if you had used a sustainable 4% rate for 30 years. This is especially true when high withdrawals coincide with poor early returns (sequence of returns risk).
What's the optimal withdrawal rate for my retirement?
There is no single "optimal" rate—it depends on your specific circumstances: time horizon, risk tolerance, spending flexibility, other income sources, and current market valuations. The 4% rule provides high confidence (99.2% historical success) but may be unnecessarily conservative for some situations. Dynamic strategies that adjust spending based on portfolio performance may allow higher baseline rates while maintaining safety. Use historical backtesting tools like Bellavia to test your specific scenario.
Should I use historical data or Monte Carlo simulations for retirement planning?
Both approaches have value. Historical data shows what actually happened during real crises—the 1929 crash, 1970s stagflation, 2008 financial crisis—which Monte Carlo simulations may not fully capture since they assume returns follow statistical distributions. However, historical data is limited to past conditions. The best approach uses both: historical backtesting to understand real failure patterns, supplemented by Monte Carlo analysis to explore scenarios outside historical experience.
Related Reading
For more detailed retirement planning guidance, check out these related articles:
- The 4% Rule: Why the Creator Says His Own Formula Is Wrong
- How Long Will $1 Million Last in Retirement?
- The Value of Historical Data for Retirement Planning
- Understanding Sequence of Returns Risk
References and Data Sources
- Bengen, William P. (1994). "Determining Withdrawal Rates Using Historical Data." Journal of Financial Planning.
- Cooley, Philip L., Carl M. Hubbard, and Daniel T. Walz (1998). "Retirement Savings: Choosing a Withdrawal Rate That Is Sustainable." AAII Journal.
- Historical Market Data: Robert Shiller's stock market database (1871-present), available at Yale Department of Economics
- Analysis Platform: All simulations and charts created using Bellavia Premium Analytics
Discussion (0)
Join the conversation
Log in to commentNo comments yet. Be the first to share your thoughts!